Immigrants from Barbados vs Alsatian Male Unemployment
COMPARE
Immigrants from Barbados
Alsatian
Male Unemployment
Male Unemployment Comparison
Immigrants from Barbados
Alsatians
7.1%
MALE UNEMPLOYMENT
0.0/ 100
METRIC RATING
314th/ 347
METRIC RANK
5.4%
MALE UNEMPLOYMENT
16.7/ 100
METRIC RATING
197th/ 347
METRIC RANK
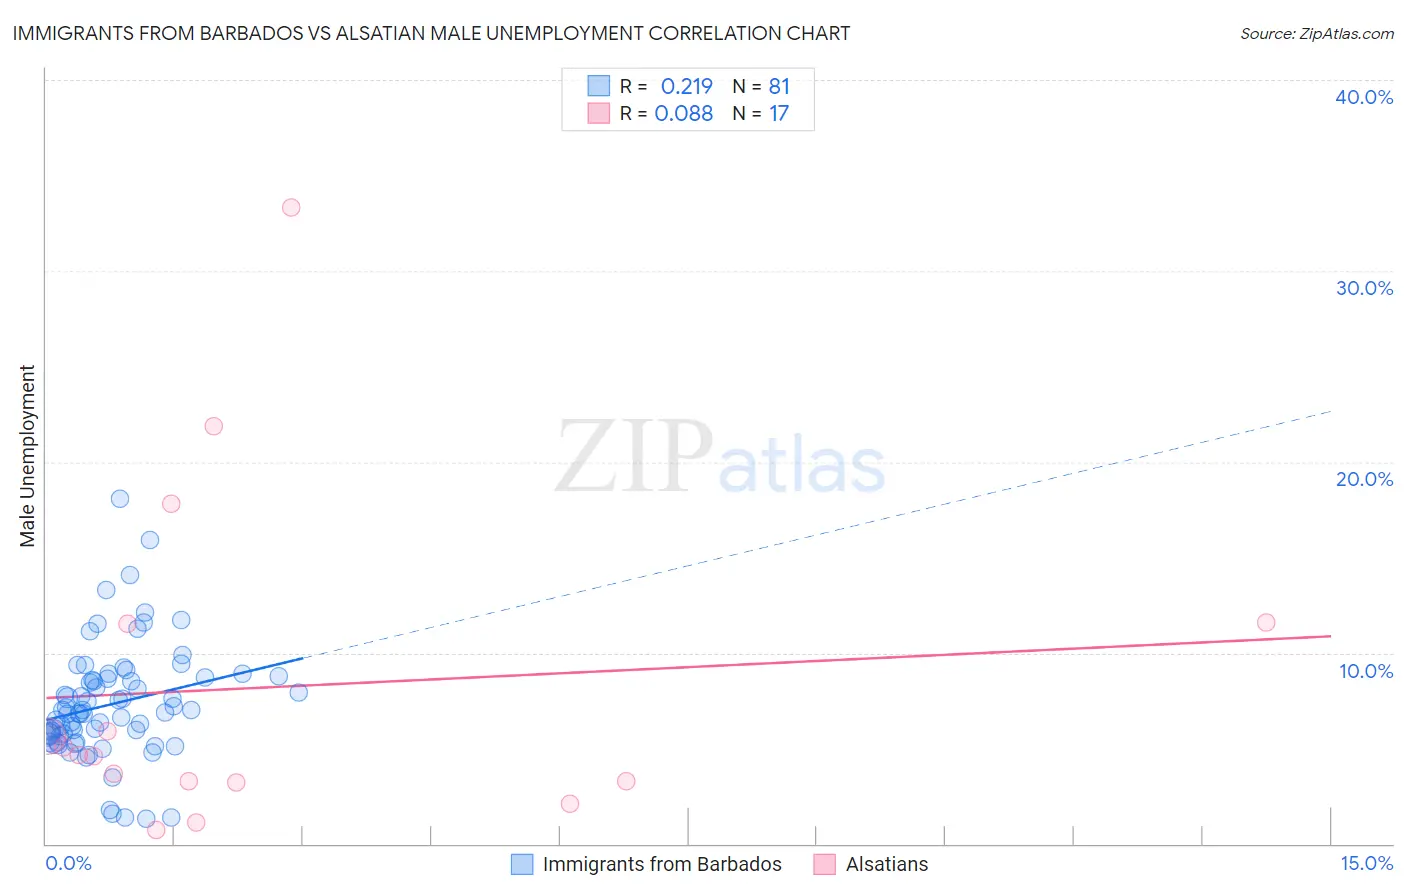
Immigrants from Barbados vs Alsatian Male Unemployment Correlation Chart
The statistical analysis conducted on geographies consisting of 112,710,362 people shows a weak positive correlation between the proportion of Immigrants from Barbados and unemployment rate among males in the United States with a correlation coefficient (R) of 0.219 and weighted average of 7.1%. Similarly, the statistical analysis conducted on geographies consisting of 82,581,733 people shows a slight positive correlation between the proportion of Alsatians and unemployment rate among males in the United States with a correlation coefficient (R) of 0.088 and weighted average of 5.4%, a difference of 30.9%.
Male Unemployment Correlation Summary
| Measurement | Immigrants from Barbados | Alsatian |
| Minimum | 1.3% | 0.70% |
| Maximum | 18.1% | 33.3% |
| Range | 16.8% | 32.6% |
| Mean | 7.3% | 8.2% |
| Median | 6.9% | 4.7% |
| Interquartile 25% (IQ1) | 5.7% | 3.3% |
| Interquartile 75% (IQ3) | 8.7% | 11.6% |
| Interquartile Range (IQR) | 3.0% | 8.3% |
| Standard Deviation (Sample) | 3.0% | 8.7% |
| Standard Deviation (Population) | 3.0% | 8.5% |
Similar Demographics by Male Unemployment
Demographics Similar to Immigrants from Barbados by Male Unemployment
In terms of male unemployment, the demographic groups most similar to Immigrants from Barbados are Houma (7.1%, a difference of 0.21%), Immigrants from Guyana (7.1%, a difference of 0.24%), Guyanese (7.1%, a difference of 0.30%), Cape Verdean (7.1%, a difference of 0.36%), and Immigrants from Dominica (7.0%, a difference of 1.3%).
| Demographics | Rating | Rank | Male Unemployment |
| Immigrants | Jamaica | 0.0 /100 | #307 | Tragic 6.7% |
| Aleuts | 0.0 /100 | #308 | Tragic 6.8% |
| Barbadians | 0.0 /100 | #309 | Tragic 6.9% |
| Blacks/African Americans | 0.0 /100 | #310 | Tragic 6.9% |
| Immigrants | Armenia | 0.0 /100 | #311 | Tragic 6.9% |
| Lumbee | 0.0 /100 | #312 | Tragic 6.9% |
| Immigrants | Dominica | 0.0 /100 | #313 | Tragic 7.0% |
| Immigrants | Barbados | 0.0 /100 | #314 | Tragic 7.1% |
| Houma | 0.0 /100 | #315 | Tragic 7.1% |
| Immigrants | Guyana | 0.0 /100 | #316 | Tragic 7.1% |
| Guyanese | 0.0 /100 | #317 | Tragic 7.1% |
| Cape Verdeans | 0.0 /100 | #318 | Tragic 7.1% |
| British West Indians | 0.0 /100 | #319 | Tragic 7.3% |
| Colville | 0.0 /100 | #320 | Tragic 7.4% |
| Immigrants | St. Vincent and the Grenadines | 0.0 /100 | #321 | Tragic 7.5% |
Demographics Similar to Alsatians by Male Unemployment
In terms of male unemployment, the demographic groups most similar to Alsatians are Albanian (5.4%, a difference of 0.060%), Immigrants from Southern Europe (5.4%, a difference of 0.10%), Immigrants from Thailand (5.4%, a difference of 0.22%), Immigrants from Greece (5.4%, a difference of 0.24%), and Spanish (5.4%, a difference of 0.28%).
| Demographics | Rating | Rank | Male Unemployment |
| Immigrants | Uganda | 28.8 /100 | #190 | Fair 5.4% |
| Immigrants | South Eastern Asia | 28.2 /100 | #191 | Fair 5.4% |
| Immigrants | Belarus | 26.0 /100 | #192 | Fair 5.4% |
| Immigrants | Israel | 25.2 /100 | #193 | Fair 5.4% |
| Spanish | 19.7 /100 | #194 | Poor 5.4% |
| Immigrants | Southern Europe | 17.7 /100 | #195 | Poor 5.4% |
| Albanians | 17.3 /100 | #196 | Poor 5.4% |
| Alsatians | 16.7 /100 | #197 | Poor 5.4% |
| Immigrants | Thailand | 14.7 /100 | #198 | Poor 5.4% |
| Immigrants | Greece | 14.5 /100 | #199 | Poor 5.4% |
| Immigrants | Zaire | 13.7 /100 | #200 | Poor 5.4% |
| Immigrants | Philippines | 13.5 /100 | #201 | Poor 5.4% |
| Immigrants | Nonimmigrants | 13.1 /100 | #202 | Poor 5.4% |
| Immigrants | Laos | 13.0 /100 | #203 | Poor 5.4% |
| Guamanians/Chamorros | 12.3 /100 | #204 | Poor 5.4% |