Immigrants from Bangladesh vs Vietnamese Unemployment
COMPARE
Immigrants from Bangladesh
Vietnamese
Unemployment
Unemployment Comparison
Immigrants from Bangladesh
Vietnamese
6.5%
UNEMPLOYMENT
0.0/ 100
METRIC RATING
307th/ 347
METRIC RANK
6.5%
UNEMPLOYMENT
0.0/ 100
METRIC RATING
309th/ 347
METRIC RANK
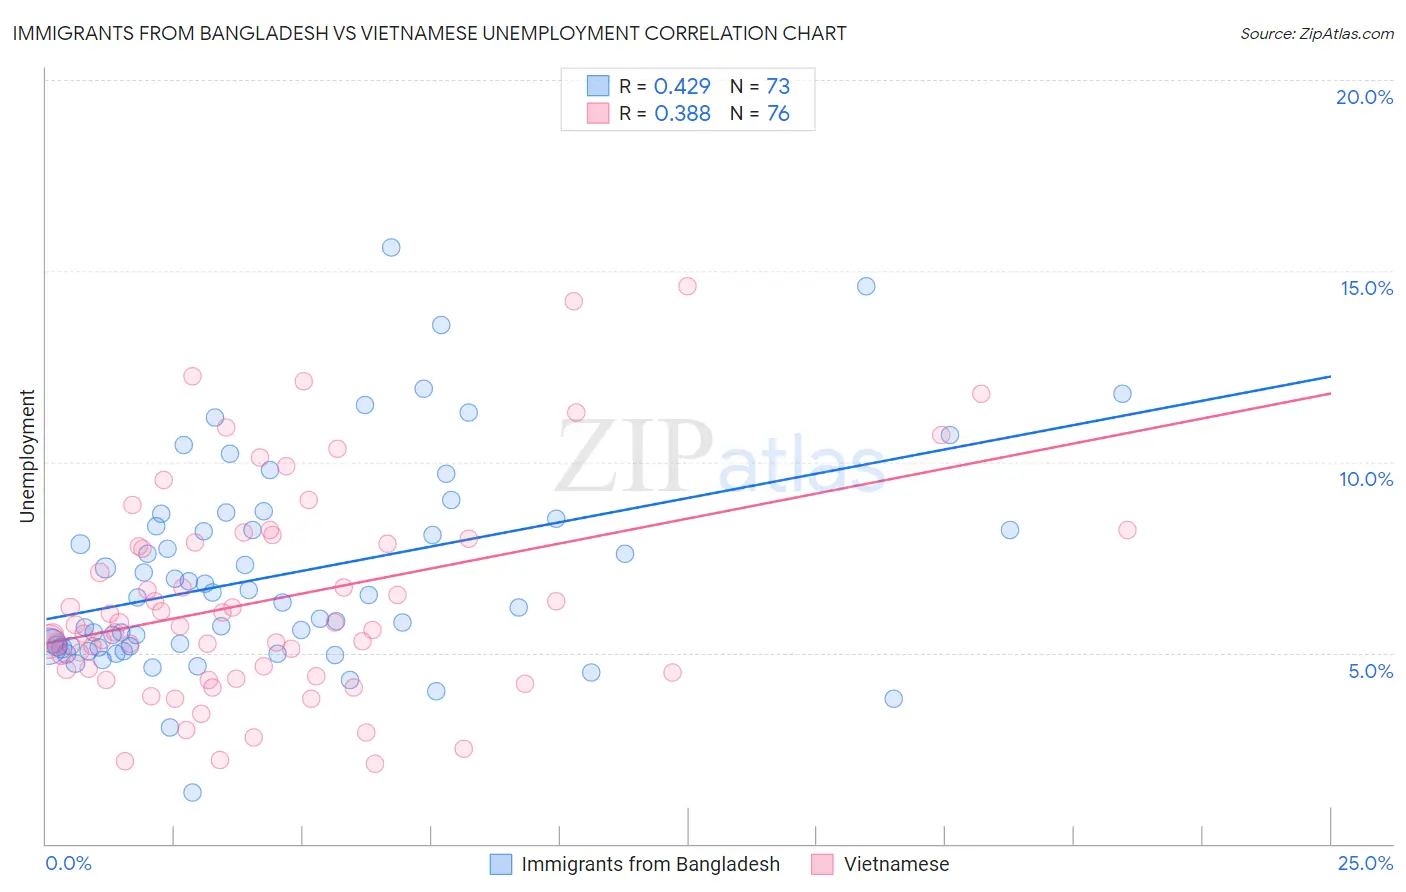
Immigrants from Bangladesh vs Vietnamese Unemployment Correlation Chart
The statistical analysis conducted on geographies consisting of 203,636,298 people shows a moderate positive correlation between the proportion of Immigrants from Bangladesh and unemployment in the United States with a correlation coefficient (R) of 0.429 and weighted average of 6.5%. Similarly, the statistical analysis conducted on geographies consisting of 170,737,868 people shows a mild positive correlation between the proportion of Vietnamese and unemployment in the United States with a correlation coefficient (R) of 0.388 and weighted average of 6.5%, a difference of 0.38%.
Unemployment Correlation Summary
| Measurement | Immigrants from Bangladesh | Vietnamese |
| Minimum | 1.3% | 2.1% |
| Maximum | 15.6% | 14.6% |
| Range | 14.3% | 12.5% |
| Mean | 7.1% | 6.4% |
| Median | 6.5% | 5.7% |
| Interquartile 25% (IQ1) | 5.2% | 4.5% |
| Interquartile 75% (IQ3) | 8.4% | 8.0% |
| Interquartile Range (IQR) | 3.2% | 3.4% |
| Standard Deviation (Sample) | 2.7% | 2.8% |
| Standard Deviation (Population) | 2.7% | 2.8% |
Demographics Similar to Immigrants from Bangladesh and Vietnamese by Unemployment
In terms of unemployment, the demographic groups most similar to Immigrants from Bangladesh are Barbadian (6.5%, a difference of 0.37%), Lumbee (6.4%, a difference of 0.48%), Menominee (6.4%, a difference of 0.52%), Immigrants from Belize (6.5%, a difference of 0.65%), and Immigrants from Jamaica (6.4%, a difference of 0.77%). Similarly, the demographic groups most similar to Vietnamese are Barbadian (6.5%, a difference of 0.010%), Immigrants from Belize (6.5%, a difference of 0.27%), Cape Verdean (6.5%, a difference of 0.60%), Lumbee (6.4%, a difference of 0.87%), and Menominee (6.4%, a difference of 0.90%).
| Demographics | Rating | Rank | Unemployment |
| Immigrants | Haiti | 0.0 /100 | #298 | Tragic 6.3% |
| Immigrants | West Indies | 0.0 /100 | #299 | Tragic 6.3% |
| Immigrants | Trinidad and Tobago | 0.0 /100 | #300 | Tragic 6.3% |
| Trinidadians and Tobagonians | 0.0 /100 | #301 | Tragic 6.3% |
| West Indians | 0.0 /100 | #302 | Tragic 6.4% |
| Belizeans | 0.0 /100 | #303 | Tragic 6.4% |
| Immigrants | Jamaica | 0.0 /100 | #304 | Tragic 6.4% |
| Menominee | 0.0 /100 | #305 | Tragic 6.4% |
| Lumbee | 0.0 /100 | #306 | Tragic 6.4% |
| Immigrants | Bangladesh | 0.0 /100 | #307 | Tragic 6.5% |
| Barbadians | 0.0 /100 | #308 | Tragic 6.5% |
| Vietnamese | 0.0 /100 | #309 | Tragic 6.5% |
| Immigrants | Belize | 0.0 /100 | #310 | Tragic 6.5% |
| Cape Verdeans | 0.0 /100 | #311 | Tragic 6.5% |
| Colville | 0.0 /100 | #312 | Tragic 6.6% |
| Immigrants | Barbados | 0.0 /100 | #313 | Tragic 6.6% |
| Blacks/African Americans | 0.0 /100 | #314 | Tragic 6.6% |
| Houma | 0.0 /100 | #315 | Tragic 6.7% |
| Immigrants | Dominica | 0.0 /100 | #316 | Tragic 6.7% |
| Shoshone | 0.0 /100 | #317 | Tragic 6.8% |
| Immigrants | Cabo Verde | 0.0 /100 | #318 | Tragic 6.8% |