Immigrants from Bangladesh vs Pakistani Unemployment Among Ages 55 to 59 years
COMPARE
Immigrants from Bangladesh
Pakistani
Unemployment Among Ages 55 to 59 years
Unemployment Among Ages 55 to 59 years Comparison
Immigrants from Bangladesh
Pakistanis
5.9%
UNEMPLOYMENT AMONG AGES 55 TO 59 YEARS
0.0/ 100
METRIC RATING
323rd/ 347
METRIC RANK
4.7%
UNEMPLOYMENT AMONG AGES 55 TO 59 YEARS
89.7/ 100
METRIC RATING
121st/ 347
METRIC RANK
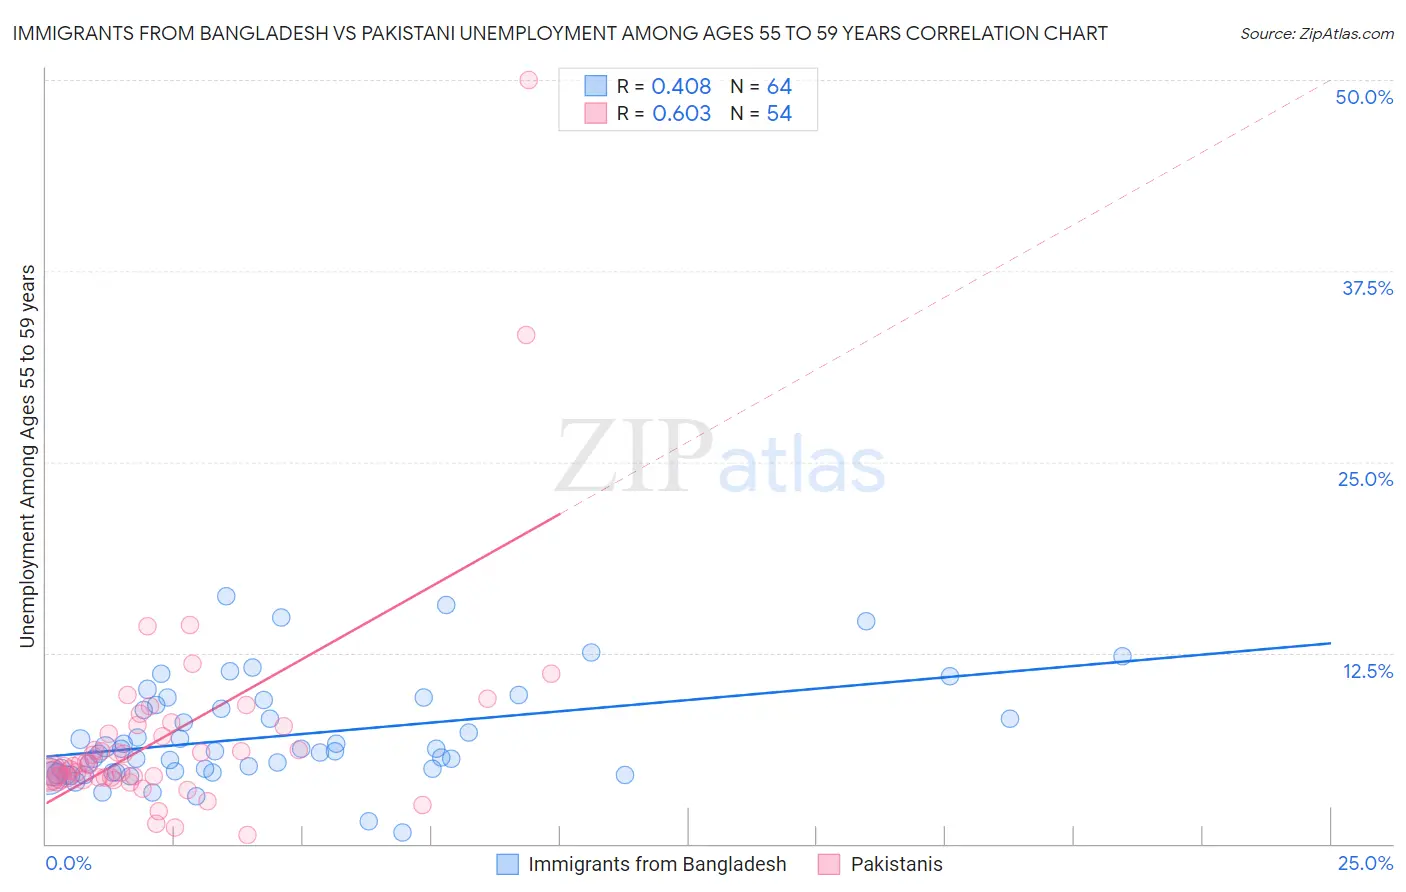
Immigrants from Bangladesh vs Pakistani Unemployment Among Ages 55 to 59 years Correlation Chart
The statistical analysis conducted on geographies consisting of 197,340,217 people shows a moderate positive correlation between the proportion of Immigrants from Bangladesh and unemployment rate among population between the ages 55 and 59 in the United States with a correlation coefficient (R) of 0.408 and weighted average of 5.9%. Similarly, the statistical analysis conducted on geographies consisting of 317,405,059 people shows a significant positive correlation between the proportion of Pakistanis and unemployment rate among population between the ages 55 and 59 in the United States with a correlation coefficient (R) of 0.603 and weighted average of 4.7%, a difference of 24.7%.
Unemployment Among Ages 55 to 59 years Correlation Summary
| Measurement | Immigrants from Bangladesh | Pakistani |
| Minimum | 0.70% | 0.60% |
| Maximum | 16.2% | 50.0% |
| Range | 15.5% | 49.4% |
| Mean | 7.0% | 7.1% |
| Median | 6.0% | 5.1% |
| Interquartile 25% (IQ1) | 4.7% | 4.3% |
| Interquartile 75% (IQ3) | 9.0% | 7.7% |
| Interquartile Range (IQR) | 4.3% | 3.4% |
| Standard Deviation (Sample) | 3.3% | 7.6% |
| Standard Deviation (Population) | 3.3% | 7.5% |
Similar Demographics by Unemployment Among Ages 55 to 59 years
Demographics Similar to Immigrants from Bangladesh by Unemployment Among Ages 55 to 59 years
In terms of unemployment among ages 55 to 59 years, the demographic groups most similar to Immigrants from Bangladesh are Crow (5.9%, a difference of 0.010%), Chippewa (5.9%, a difference of 0.070%), Vietnamese (5.9%, a difference of 0.070%), Immigrants from Armenia (6.0%, a difference of 1.8%), and Immigrants from the Azores (5.8%, a difference of 1.9%).
| Demographics | Rating | Rank | Unemployment Among Ages 55 to 59 years |
| Immigrants | Ecuador | 0.0 /100 | #316 | Tragic 5.7% |
| Hmong | 0.0 /100 | #317 | Tragic 5.7% |
| Immigrants | Guyana | 0.0 /100 | #318 | Tragic 5.8% |
| Kiowa | 0.0 /100 | #319 | Tragic 5.8% |
| Immigrants | Azores | 0.0 /100 | #320 | Tragic 5.8% |
| Chippewa | 0.0 /100 | #321 | Tragic 5.9% |
| Crow | 0.0 /100 | #322 | Tragic 5.9% |
| Immigrants | Bangladesh | 0.0 /100 | #323 | Tragic 5.9% |
| Vietnamese | 0.0 /100 | #324 | Tragic 5.9% |
| Immigrants | Armenia | 0.0 /100 | #325 | Tragic 6.0% |
| Natives/Alaskans | 0.0 /100 | #326 | Tragic 6.0% |
| Arapaho | 0.0 /100 | #327 | Tragic 6.1% |
| Yuman | 0.0 /100 | #328 | Tragic 6.1% |
| Dominicans | 0.0 /100 | #329 | Tragic 6.2% |
| Alaska Natives | 0.0 /100 | #330 | Tragic 6.2% |
Demographics Similar to Pakistanis by Unemployment Among Ages 55 to 59 years
In terms of unemployment among ages 55 to 59 years, the demographic groups most similar to Pakistanis are Immigrants from South Africa (4.7%, a difference of 0.020%), Immigrants from Afghanistan (4.7%, a difference of 0.020%), Immigrants from Japan (4.7%, a difference of 0.030%), Lithuanian (4.7%, a difference of 0.090%), and Immigrants from Chile (4.7%, a difference of 0.12%).
| Demographics | Rating | Rank | Unemployment Among Ages 55 to 59 years |
| Bangladeshis | 91.3 /100 | #114 | Exceptional 4.7% |
| South American Indians | 90.9 /100 | #115 | Exceptional 4.7% |
| Turks | 90.9 /100 | #116 | Exceptional 4.7% |
| Asians | 90.8 /100 | #117 | Exceptional 4.7% |
| Immigrants | Chile | 90.7 /100 | #118 | Exceptional 4.7% |
| Whites/Caucasians | 90.7 /100 | #119 | Exceptional 4.7% |
| Immigrants | South Africa | 89.9 /100 | #120 | Excellent 4.7% |
| Pakistanis | 89.7 /100 | #121 | Excellent 4.7% |
| Immigrants | Afghanistan | 89.5 /100 | #122 | Excellent 4.7% |
| Immigrants | Japan | 89.4 /100 | #123 | Excellent 4.7% |
| Lithuanians | 88.8 /100 | #124 | Excellent 4.7% |
| Immigrants | Malaysia | 87.9 /100 | #125 | Excellent 4.7% |
| Immigrants | Serbia | 87.8 /100 | #126 | Excellent 4.7% |
| Icelanders | 87.7 /100 | #127 | Excellent 4.7% |
| Pennsylvania Germans | 87.1 /100 | #128 | Excellent 4.7% |