Immigrants from Bangladesh vs Laotian Unemployment Among Ages 30 to 34 years
COMPARE
Immigrants from Bangladesh
Laotian
Unemployment Among Ages 30 to 34 years
Unemployment Among Ages 30 to 34 years Comparison
Immigrants from Bangladesh
Laotians
6.4%
UNEMPLOYMENT AMONG AGES 30 TO 34 YEARS
0.0/ 100
METRIC RATING
284th/ 347
METRIC RANK
5.2%
UNEMPLOYMENT AMONG AGES 30 TO 34 YEARS
92.4/ 100
METRIC RATING
93rd/ 347
METRIC RANK
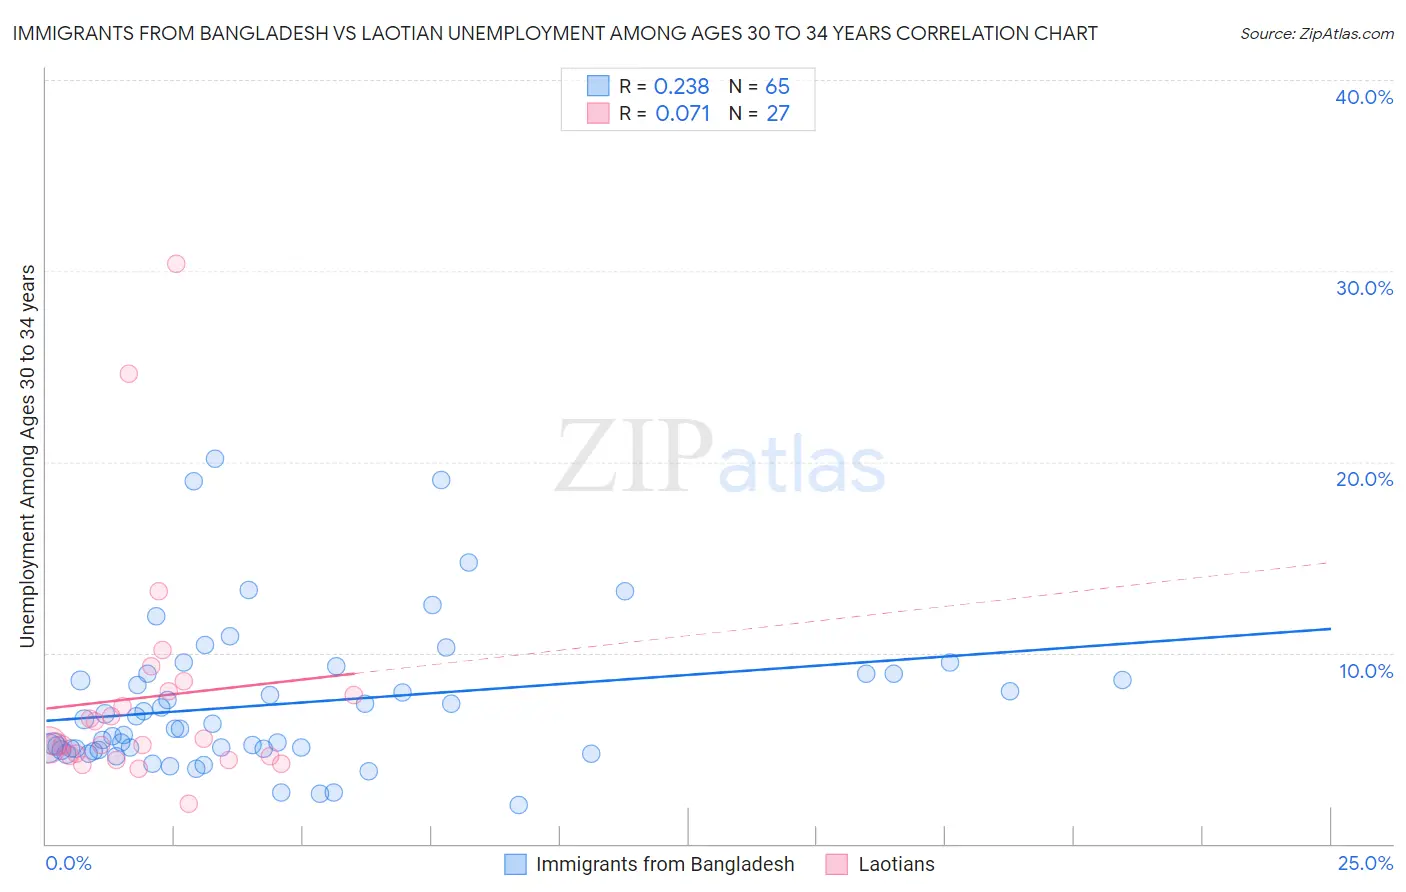
Immigrants from Bangladesh vs Laotian Unemployment Among Ages 30 to 34 years Correlation Chart
The statistical analysis conducted on geographies consisting of 199,135,967 people shows a weak positive correlation between the proportion of Immigrants from Bangladesh and unemployment rate among population between the ages 30 and 34 in the United States with a correlation coefficient (R) of 0.238 and weighted average of 6.4%. Similarly, the statistical analysis conducted on geographies consisting of 218,386,667 people shows a slight positive correlation between the proportion of Laotians and unemployment rate among population between the ages 30 and 34 in the United States with a correlation coefficient (R) of 0.071 and weighted average of 5.2%, a difference of 22.9%.
Unemployment Among Ages 30 to 34 years Correlation Summary
| Measurement | Immigrants from Bangladesh | Laotian |
| Minimum | 2.0% | 2.1% |
| Maximum | 20.2% | 30.4% |
| Range | 18.2% | 28.3% |
| Mean | 7.3% | 7.7% |
| Median | 6.0% | 5.2% |
| Interquartile 25% (IQ1) | 4.9% | 4.6% |
| Interquartile 75% (IQ3) | 8.9% | 8.0% |
| Interquartile Range (IQR) | 3.9% | 3.4% |
| Standard Deviation (Sample) | 3.8% | 6.2% |
| Standard Deviation (Population) | 3.8% | 6.1% |
Similar Demographics by Unemployment Among Ages 30 to 34 years
Demographics Similar to Immigrants from Bangladesh by Unemployment Among Ages 30 to 34 years
In terms of unemployment among ages 30 to 34 years, the demographic groups most similar to Immigrants from Bangladesh are Hispanic or Latino (6.4%, a difference of 0.060%), African (6.4%, a difference of 0.090%), Choctaw (6.4%, a difference of 0.10%), Central American Indian (6.4%, a difference of 0.14%), and Immigrants from West Indies (6.4%, a difference of 0.17%).
| Demographics | Rating | Rank | Unemployment Among Ages 30 to 34 years |
| Immigrants | Ecuador | 0.0 /100 | #277 | Tragic 6.3% |
| Osage | 0.0 /100 | #278 | Tragic 6.3% |
| Cree | 0.0 /100 | #279 | Tragic 6.4% |
| Cherokee | 0.0 /100 | #280 | Tragic 6.4% |
| Immigrants | Caribbean | 0.0 /100 | #281 | Tragic 6.4% |
| Africans | 0.0 /100 | #282 | Tragic 6.4% |
| Hispanics or Latinos | 0.0 /100 | #283 | Tragic 6.4% |
| Immigrants | Bangladesh | 0.0 /100 | #284 | Tragic 6.4% |
| Choctaw | 0.0 /100 | #285 | Tragic 6.4% |
| Central American Indians | 0.0 /100 | #286 | Tragic 6.4% |
| Immigrants | West Indies | 0.0 /100 | #287 | Tragic 6.4% |
| Senegalese | 0.0 /100 | #288 | Tragic 6.4% |
| Menominee | 0.0 /100 | #289 | Tragic 6.4% |
| Immigrants | Trinidad and Tobago | 0.0 /100 | #290 | Tragic 6.5% |
| Jamaicans | 0.0 /100 | #291 | Tragic 6.5% |
Demographics Similar to Laotians by Unemployment Among Ages 30 to 34 years
In terms of unemployment among ages 30 to 34 years, the demographic groups most similar to Laotians are Maltese (5.2%, a difference of 0.0%), Immigrants from Argentina (5.2%, a difference of 0.050%), Iraqi (5.2%, a difference of 0.070%), Kenyan (5.2%, a difference of 0.070%), and Immigrants from Romania (5.2%, a difference of 0.12%).
| Demographics | Rating | Rank | Unemployment Among Ages 30 to 34 years |
| Immigrants | Australia | 93.5 /100 | #86 | Exceptional 5.2% |
| Bhutanese | 93.5 /100 | #87 | Exceptional 5.2% |
| Immigrants | Kenya | 93.3 /100 | #88 | Exceptional 5.2% |
| Immigrants | Sweden | 93.3 /100 | #89 | Exceptional 5.2% |
| Immigrants | Romania | 92.8 /100 | #90 | Exceptional 5.2% |
| Iraqis | 92.6 /100 | #91 | Exceptional 5.2% |
| Immigrants | Argentina | 92.5 /100 | #92 | Exceptional 5.2% |
| Laotians | 92.4 /100 | #93 | Exceptional 5.2% |
| Maltese | 92.3 /100 | #94 | Exceptional 5.2% |
| Kenyans | 92.1 /100 | #95 | Exceptional 5.2% |
| Mongolians | 91.7 /100 | #96 | Exceptional 5.2% |
| Europeans | 91.7 /100 | #97 | Exceptional 5.2% |
| Immigrants | North Macedonia | 90.9 /100 | #98 | Exceptional 5.2% |
| Immigrants | Ireland | 90.6 /100 | #99 | Exceptional 5.2% |
| Immigrants | Czechoslovakia | 89.5 /100 | #100 | Excellent 5.3% |