Immigrants from Bahamas vs Syrian Unemployment Among Seniors over 75 years
COMPARE
Immigrants from Bahamas
Syrian
Unemployment Among Seniors over 75 years
Unemployment Among Seniors over 75 years Comparison
Immigrants from Bahamas
Syrians
8.6%
UNEMPLOYMENT AMONG SENIORS OVER 75 YEARS
76.5/ 100
METRIC RATING
156th/ 347
METRIC RANK
8.7%
UNEMPLOYMENT AMONG SENIORS OVER 75 YEARS
49.6/ 100
METRIC RATING
175th/ 347
METRIC RANK
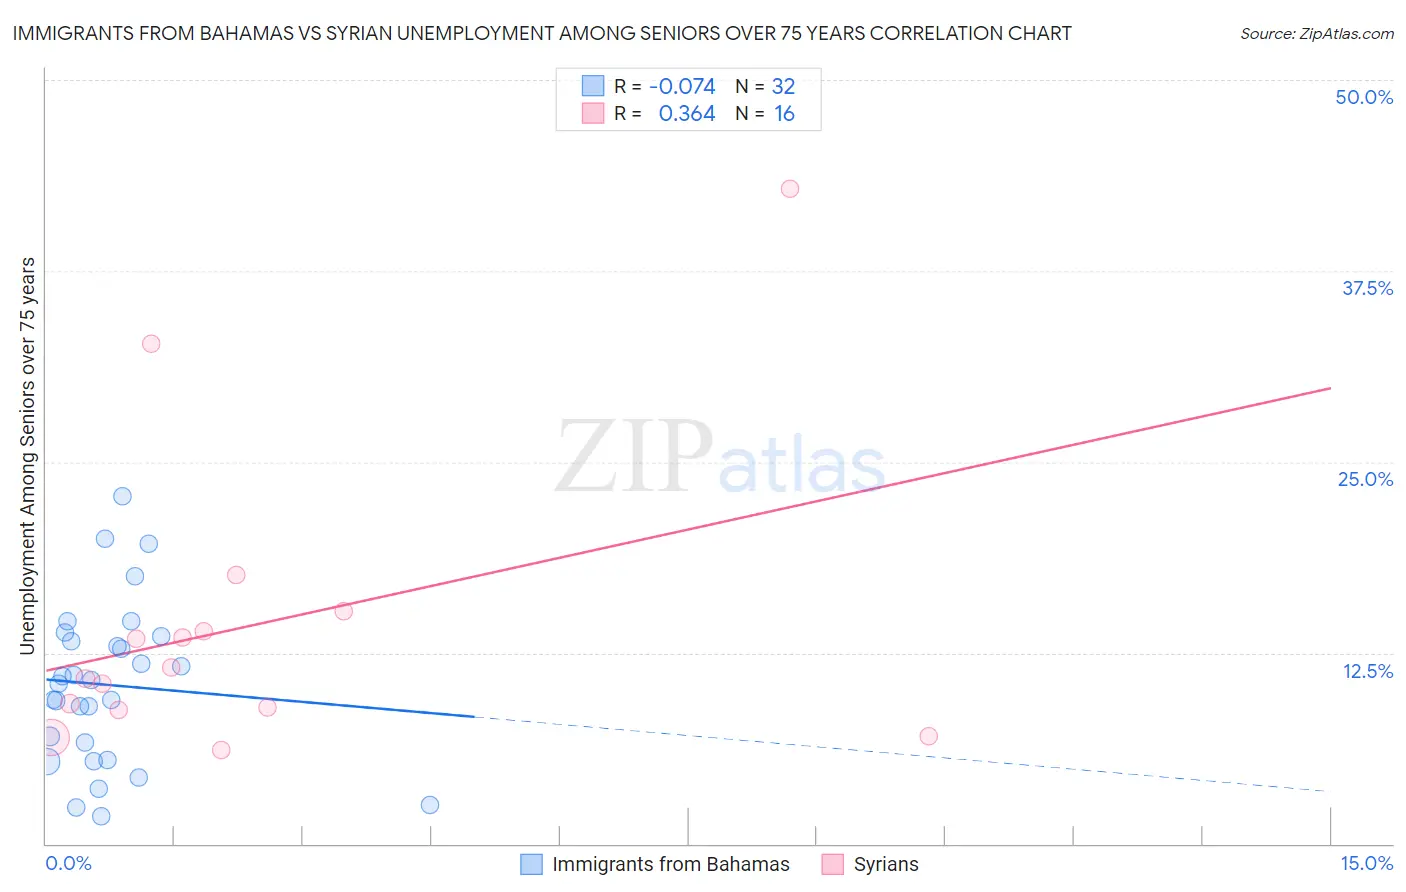
Immigrants from Bahamas vs Syrian Unemployment Among Seniors over 75 years Correlation Chart
The statistical analysis conducted on geographies consisting of 77,798,406 people shows a slight negative correlation between the proportion of Immigrants from Bahamas and unemployment rate among seniors over the age of 75 in the United States with a correlation coefficient (R) of -0.074 and weighted average of 8.6%. Similarly, the statistical analysis conducted on geographies consisting of 159,275,493 people shows a mild positive correlation between the proportion of Syrians and unemployment rate among seniors over the age of 75 in the United States with a correlation coefficient (R) of 0.364 and weighted average of 8.7%, a difference of 1.6%.
Unemployment Among Seniors over 75 years Correlation Summary
| Measurement | Immigrants from Bahamas | Syrian |
| Minimum | 1.8% | 6.2% |
| Maximum | 22.7% | 42.9% |
| Range | 20.9% | 36.7% |
| Mean | 10.4% | 14.3% |
| Median | 10.6% | 11.2% |
| Interquartile 25% (IQ1) | 6.1% | 8.8% |
| Interquartile 75% (IQ3) | 13.4% | 14.6% |
| Interquartile Range (IQR) | 7.3% | 5.7% |
| Standard Deviation (Sample) | 5.2% | 9.9% |
| Standard Deviation (Population) | 5.2% | 9.6% |
Demographics Similar to Immigrants from Bahamas and Syrians by Unemployment Among Seniors over 75 years
In terms of unemployment among seniors over 75 years, the demographic groups most similar to Immigrants from Bahamas are Turkish (8.6%, a difference of 0.010%), Ethiopian (8.6%, a difference of 0.090%), Shoshone (8.6%, a difference of 0.14%), Ecuadorian (8.6%, a difference of 0.16%), and Cree (8.6%, a difference of 0.26%). Similarly, the demographic groups most similar to Syrians are Immigrants from El Salvador (8.7%, a difference of 0.010%), Australian (8.7%, a difference of 0.040%), Dominican (8.7%, a difference of 0.12%), Immigrants (8.7%, a difference of 0.12%), and Zimbabwean (8.7%, a difference of 0.24%).
| Demographics | Rating | Rank | Unemployment Among Seniors over 75 years |
| Ecuadorians | 78.5 /100 | #155 | Good 8.6% |
| Immigrants | Bahamas | 76.5 /100 | #156 | Good 8.6% |
| Turks | 76.4 /100 | #157 | Good 8.6% |
| Ethiopians | 75.3 /100 | #158 | Good 8.6% |
| Shoshone | 74.6 /100 | #159 | Good 8.6% |
| Cree | 72.8 /100 | #160 | Good 8.6% |
| Albanians | 72.8 /100 | #161 | Good 8.6% |
| Immigrants | South America | 71.3 /100 | #162 | Good 8.6% |
| Immigrants | Guatemala | 68.4 /100 | #163 | Good 8.7% |
| Paraguayans | 62.2 /100 | #164 | Good 8.7% |
| Immigrants | Dominican Republic | 61.4 /100 | #165 | Good 8.7% |
| Immigrants | Belize | 57.6 /100 | #166 | Average 8.7% |
| Immigrants | Eastern Africa | 57.6 /100 | #167 | Average 8.7% |
| Immigrants | Lithuania | 57.2 /100 | #168 | Average 8.7% |
| Fijians | 56.4 /100 | #169 | Average 8.7% |
| Zimbabweans | 54.1 /100 | #170 | Average 8.7% |
| Dominicans | 51.9 /100 | #171 | Average 8.7% |
| Immigrants | Immigrants | 51.8 /100 | #172 | Average 8.7% |
| Australians | 50.3 /100 | #173 | Average 8.7% |
| Immigrants | El Salvador | 49.7 /100 | #174 | Average 8.7% |
| Syrians | 49.6 /100 | #175 | Average 8.7% |