Immigrants from Bahamas vs Immigrants from Northern Africa Unemployment Among Seniors over 65 years
COMPARE
Immigrants from Bahamas
Immigrants from Northern Africa
Unemployment Among Seniors over 65 years
Unemployment Among Seniors over 65 years Comparison
Immigrants from Bahamas
Immigrants from Northern Africa
5.7%
UNEMPLOYMENT AMONG SENIORS OVER 65 YEARS
0.0/ 100
METRIC RATING
317th/ 347
METRIC RANK
5.2%
UNEMPLOYMENT AMONG SENIORS OVER 65 YEARS
17.7/ 100
METRIC RATING
202nd/ 347
METRIC RANK
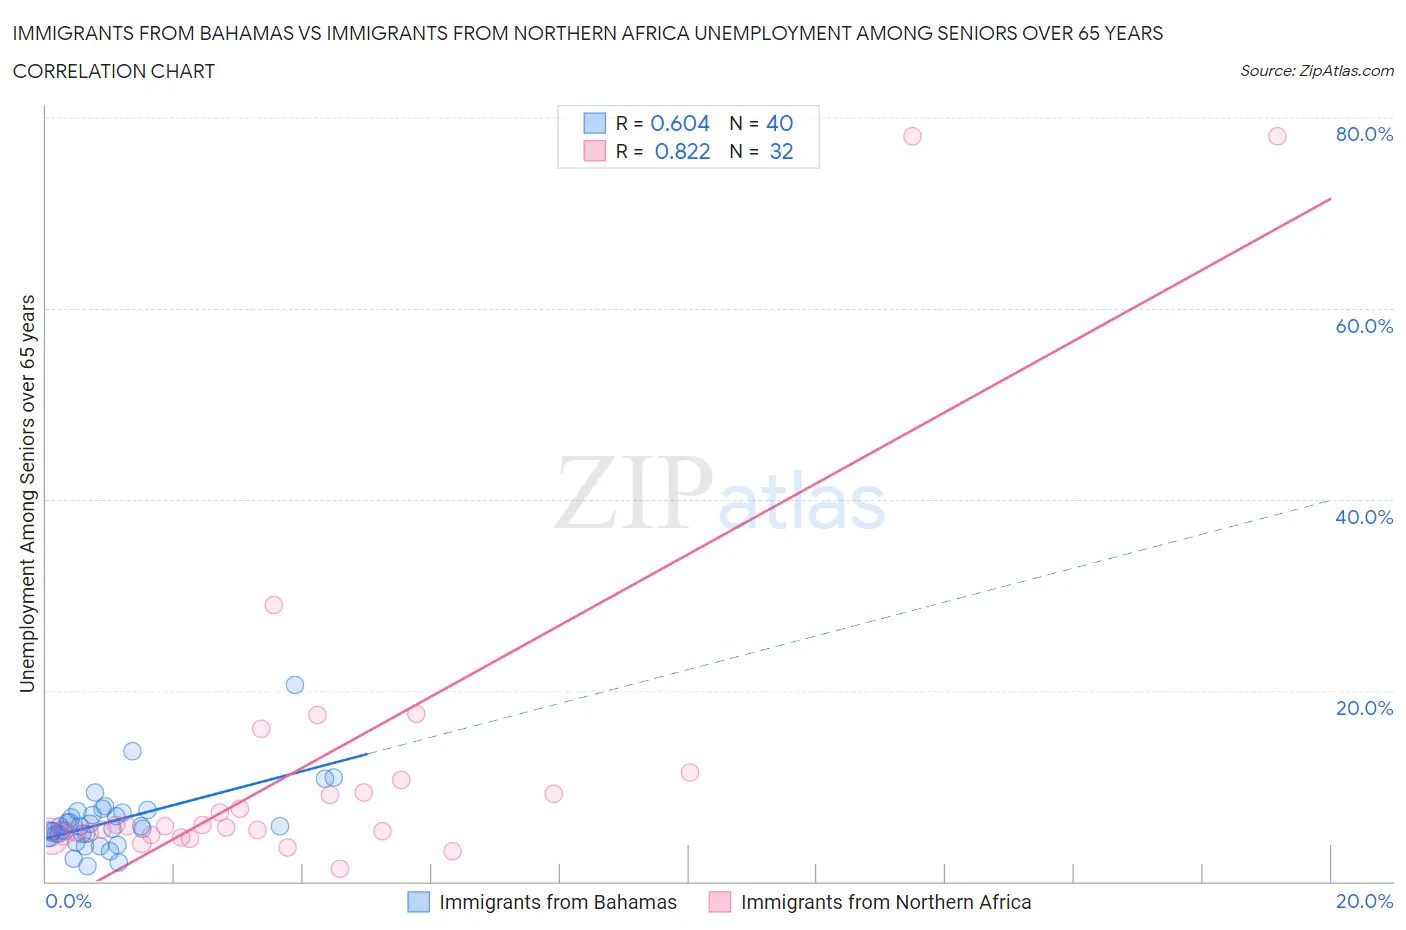
Immigrants from Bahamas vs Immigrants from Northern Africa Unemployment Among Seniors over 65 years Correlation Chart
The statistical analysis conducted on geographies consisting of 101,010,800 people shows a significant positive correlation between the proportion of Immigrants from Bahamas and unemployment rate amomg seniors over the age of 65 in the United States with a correlation coefficient (R) of 0.604 and weighted average of 5.7%. Similarly, the statistical analysis conducted on geographies consisting of 300,034,109 people shows a very strong positive correlation between the proportion of Immigrants from Northern Africa and unemployment rate amomg seniors over the age of 65 in the United States with a correlation coefficient (R) of 0.822 and weighted average of 5.2%, a difference of 9.2%.
Unemployment Among Seniors over 65 years Correlation Summary
| Measurement | Immigrants from Bahamas | Immigrants from Northern Africa |
| Minimum | 1.6% | 1.4% |
| Maximum | 20.5% | 78.0% |
| Range | 18.9% | 76.6% |
| Mean | 6.3% | 12.2% |
| Median | 5.6% | 5.8% |
| Interquartile 25% (IQ1) | 4.9% | 4.9% |
| Interquartile 75% (IQ3) | 7.1% | 10.0% |
| Interquartile Range (IQR) | 2.1% | 5.0% |
| Standard Deviation (Sample) | 3.3% | 18.1% |
| Standard Deviation (Population) | 3.3% | 17.8% |
Similar Demographics by Unemployment Among Seniors over 65 years
Demographics Similar to Immigrants from Bahamas by Unemployment Among Seniors over 65 years
In terms of unemployment among seniors over 65 years, the demographic groups most similar to Immigrants from Bahamas are Immigrants from Central America (5.7%, a difference of 0.12%), Immigrants from El Salvador (5.7%, a difference of 0.30%), Vietnamese (5.7%, a difference of 0.32%), Delaware (5.7%, a difference of 0.34%), and Immigrants from Bangladesh (5.7%, a difference of 0.54%).
| Demographics | Rating | Rank | Unemployment Among Seniors over 65 years |
| Salvadorans | 0.0 /100 | #310 | Tragic 5.6% |
| Immigrants | Guyana | 0.0 /100 | #311 | Tragic 5.6% |
| Immigrants | Ecuador | 0.0 /100 | #312 | Tragic 5.6% |
| Barbadians | 0.0 /100 | #313 | Tragic 5.6% |
| Delaware | 0.0 /100 | #314 | Tragic 5.7% |
| Immigrants | El Salvador | 0.0 /100 | #315 | Tragic 5.7% |
| Immigrants | Central America | 0.0 /100 | #316 | Tragic 5.7% |
| Immigrants | Bahamas | 0.0 /100 | #317 | Tragic 5.7% |
| Vietnamese | 0.0 /100 | #318 | Tragic 5.7% |
| Immigrants | Bangladesh | 0.0 /100 | #319 | Tragic 5.7% |
| Immigrants | Mexico | 0.0 /100 | #320 | Tragic 5.7% |
| British West Indians | 0.0 /100 | #321 | Tragic 5.8% |
| Natives/Alaskans | 0.0 /100 | #322 | Tragic 5.8% |
| Immigrants | Dominica | 0.0 /100 | #323 | Tragic 5.8% |
| Yuman | 0.0 /100 | #324 | Tragic 5.8% |
Demographics Similar to Immigrants from Northern Africa by Unemployment Among Seniors over 65 years
In terms of unemployment among seniors over 65 years, the demographic groups most similar to Immigrants from Northern Africa are Laotian (5.2%, a difference of 0.020%), Subsaharan African (5.2%, a difference of 0.030%), Immigrants from Pakistan (5.2%, a difference of 0.040%), Immigrants from China (5.2%, a difference of 0.040%), and Immigrants from Europe (5.2%, a difference of 0.070%).
| Demographics | Rating | Rank | Unemployment Among Seniors over 65 years |
| Costa Ricans | 27.0 /100 | #195 | Fair 5.2% |
| Immigrants | Poland | 24.3 /100 | #196 | Fair 5.2% |
| Guamanians/Chamorros | 22.5 /100 | #197 | Fair 5.2% |
| Maltese | 19.6 /100 | #198 | Poor 5.2% |
| Immigrants | Europe | 19.0 /100 | #199 | Poor 5.2% |
| Immigrants | Pakistan | 18.4 /100 | #200 | Poor 5.2% |
| Laotians | 18.1 /100 | #201 | Poor 5.2% |
| Immigrants | Northern Africa | 17.7 /100 | #202 | Poor 5.2% |
| Sub-Saharan Africans | 17.1 /100 | #203 | Poor 5.2% |
| Immigrants | China | 16.9 /100 | #204 | Poor 5.2% |
| South American Indians | 15.3 /100 | #205 | Poor 5.2% |
| German Russians | 14.7 /100 | #206 | Poor 5.2% |
| Immigrants | Philippines | 13.2 /100 | #207 | Poor 5.2% |
| Uruguayans | 12.6 /100 | #208 | Poor 5.2% |
| Alsatians | 11.4 /100 | #209 | Poor 5.2% |