Immigrants from Bahamas vs Australian Unemployment Among Ages 45 to 54 years
COMPARE
Immigrants from Bahamas
Australian
Unemployment Among Ages 45 to 54 years
Unemployment Among Ages 45 to 54 years Comparison
Immigrants from Bahamas
Australians
4.8%
UNEMPLOYMENT AMONG AGES 45 TO 54 YEARS
0.3/ 100
METRIC RATING
252nd/ 347
METRIC RANK
4.3%
UNEMPLOYMENT AMONG AGES 45 TO 54 YEARS
97.4/ 100
METRIC RATING
83rd/ 347
METRIC RANK
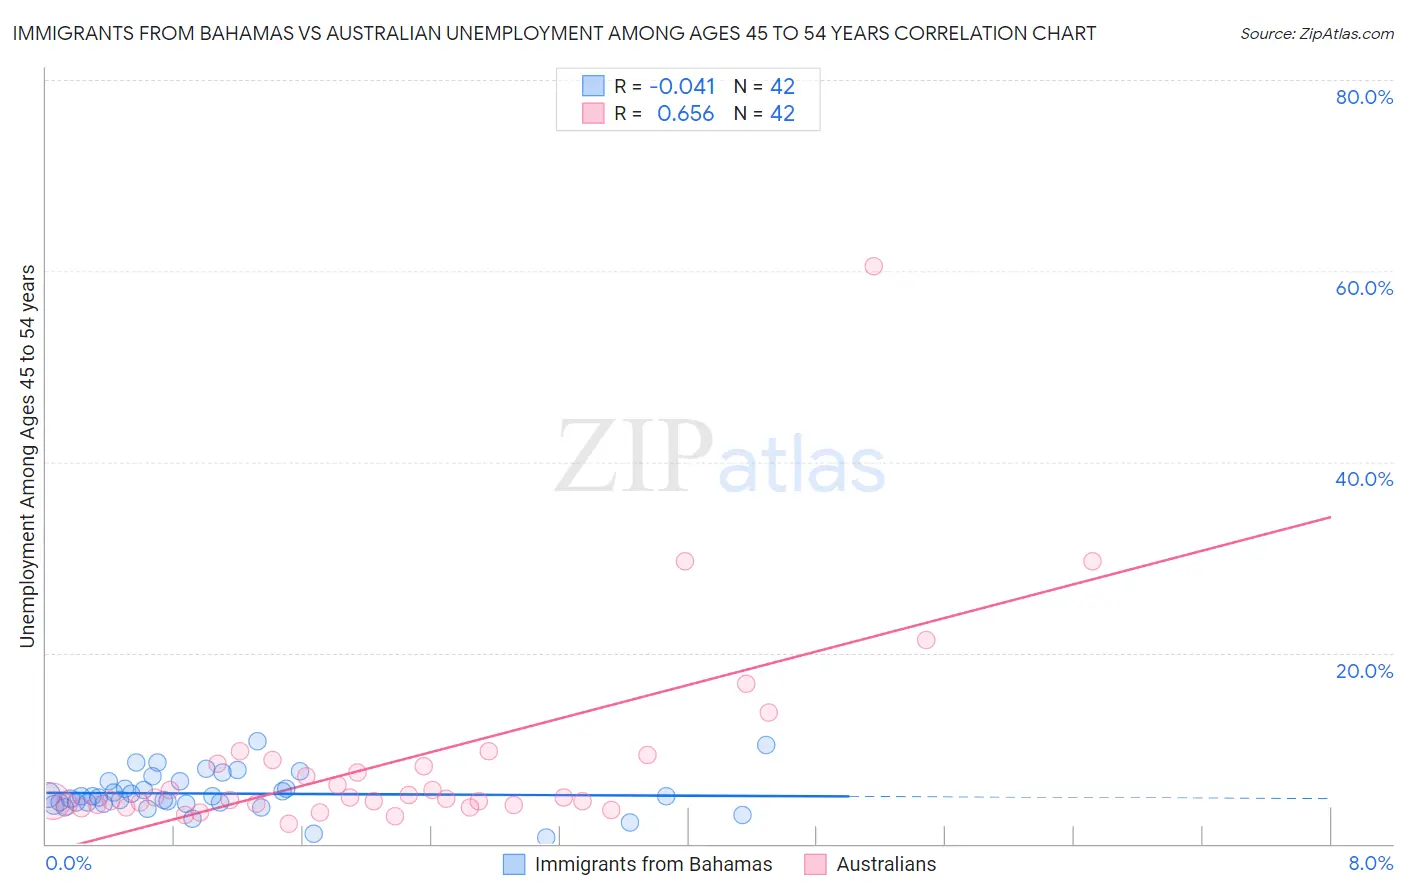
Immigrants from Bahamas vs Australian Unemployment Among Ages 45 to 54 years Correlation Chart
The statistical analysis conducted on geographies consisting of 103,881,335 people shows no correlation between the proportion of Immigrants from Bahamas and unemployment rate among population between the ages 45 and 54 in the United States with a correlation coefficient (R) of -0.041 and weighted average of 4.8%. Similarly, the statistical analysis conducted on geographies consisting of 220,525,115 people shows a significant positive correlation between the proportion of Australians and unemployment rate among population between the ages 45 and 54 in the United States with a correlation coefficient (R) of 0.656 and weighted average of 4.3%, a difference of 11.3%.
Unemployment Among Ages 45 to 54 years Correlation Summary
| Measurement | Immigrants from Bahamas | Australian |
| Minimum | 0.60% | 2.1% |
| Maximum | 10.8% | 60.5% |
| Range | 10.2% | 58.4% |
| Mean | 5.3% | 8.5% |
| Median | 5.0% | 4.8% |
| Interquartile 25% (IQ1) | 4.2% | 4.1% |
| Interquartile 75% (IQ3) | 6.5% | 8.4% |
| Interquartile Range (IQR) | 2.4% | 4.3% |
| Standard Deviation (Sample) | 2.1% | 10.4% |
| Standard Deviation (Population) | 2.1% | 10.2% |
Similar Demographics by Unemployment Among Ages 45 to 54 years
Demographics Similar to Immigrants from Bahamas by Unemployment Among Ages 45 to 54 years
In terms of unemployment among ages 45 to 54 years, the demographic groups most similar to Immigrants from Bahamas are Moroccan (4.8%, a difference of 0.17%), Honduran (4.8%, a difference of 0.24%), Immigrants from Lebanon (4.8%, a difference of 0.39%), Immigrants from El Salvador (4.8%, a difference of 0.52%), and Immigrants from Western Asia (4.8%, a difference of 0.60%).
| Demographics | Rating | Rank | Unemployment Among Ages 45 to 54 years |
| Immigrants | Albania | 0.9 /100 | #245 | Tragic 4.8% |
| Immigrants | Syria | 0.9 /100 | #246 | Tragic 4.8% |
| Israelis | 0.9 /100 | #247 | Tragic 4.8% |
| Immigrants | Liberia | 0.8 /100 | #248 | Tragic 4.8% |
| Immigrants | Honduras | 0.7 /100 | #249 | Tragic 4.8% |
| Salvadorans | 0.7 /100 | #250 | Tragic 4.8% |
| Hondurans | 0.4 /100 | #251 | Tragic 4.8% |
| Immigrants | Bahamas | 0.3 /100 | #252 | Tragic 4.8% |
| Moroccans | 0.3 /100 | #253 | Tragic 4.8% |
| Immigrants | Lebanon | 0.2 /100 | #254 | Tragic 4.8% |
| Immigrants | El Salvador | 0.2 /100 | #255 | Tragic 4.8% |
| Immigrants | Western Asia | 0.2 /100 | #256 | Tragic 4.8% |
| Immigrants | Western Africa | 0.2 /100 | #257 | Tragic 4.9% |
| Sub-Saharan Africans | 0.2 /100 | #258 | Tragic 4.9% |
| Ugandans | 0.1 /100 | #259 | Tragic 4.9% |
Demographics Similar to Australians by Unemployment Among Ages 45 to 54 years
In terms of unemployment among ages 45 to 54 years, the demographic groups most similar to Australians are Italian (4.3%, a difference of 0.040%), French (4.3%, a difference of 0.040%), Eastern European (4.3%, a difference of 0.080%), Ethiopian (4.3%, a difference of 0.080%), and Immigrants from Micronesia (4.3%, a difference of 0.11%).
| Demographics | Rating | Rank | Unemployment Among Ages 45 to 54 years |
| Slavs | 98.1 /100 | #76 | Exceptional 4.3% |
| Chileans | 98.1 /100 | #77 | Exceptional 4.3% |
| German Russians | 97.9 /100 | #78 | Exceptional 4.3% |
| Serbians | 97.9 /100 | #79 | Exceptional 4.3% |
| Cambodians | 97.8 /100 | #80 | Exceptional 4.3% |
| Immigrants | Micronesia | 97.6 /100 | #81 | Exceptional 4.3% |
| Eastern Europeans | 97.6 /100 | #82 | Exceptional 4.3% |
| Australians | 97.4 /100 | #83 | Exceptional 4.3% |
| Italians | 97.3 /100 | #84 | Exceptional 4.3% |
| French | 97.3 /100 | #85 | Exceptional 4.3% |
| Ethiopians | 97.2 /100 | #86 | Exceptional 4.3% |
| Sudanese | 97.0 /100 | #87 | Exceptional 4.3% |
| Immigrants | Turkey | 96.9 /100 | #88 | Exceptional 4.3% |
| Immigrants | Argentina | 96.9 /100 | #89 | Exceptional 4.3% |
| Asians | 96.8 /100 | #90 | Exceptional 4.3% |