Immigrants from Austria vs Immigrants from Venezuela Female Unemployment
COMPARE
Immigrants from Austria
Immigrants from Venezuela
Female Unemployment
Female Unemployment Comparison
Immigrants from Austria
Immigrants from Venezuela
5.0%
FEMALE UNEMPLOYMENT
95.7/ 100
METRIC RATING
93rd/ 347
METRIC RANK
5.0%
FEMALE UNEMPLOYMENT
97.9/ 100
METRIC RATING
76th/ 347
METRIC RANK
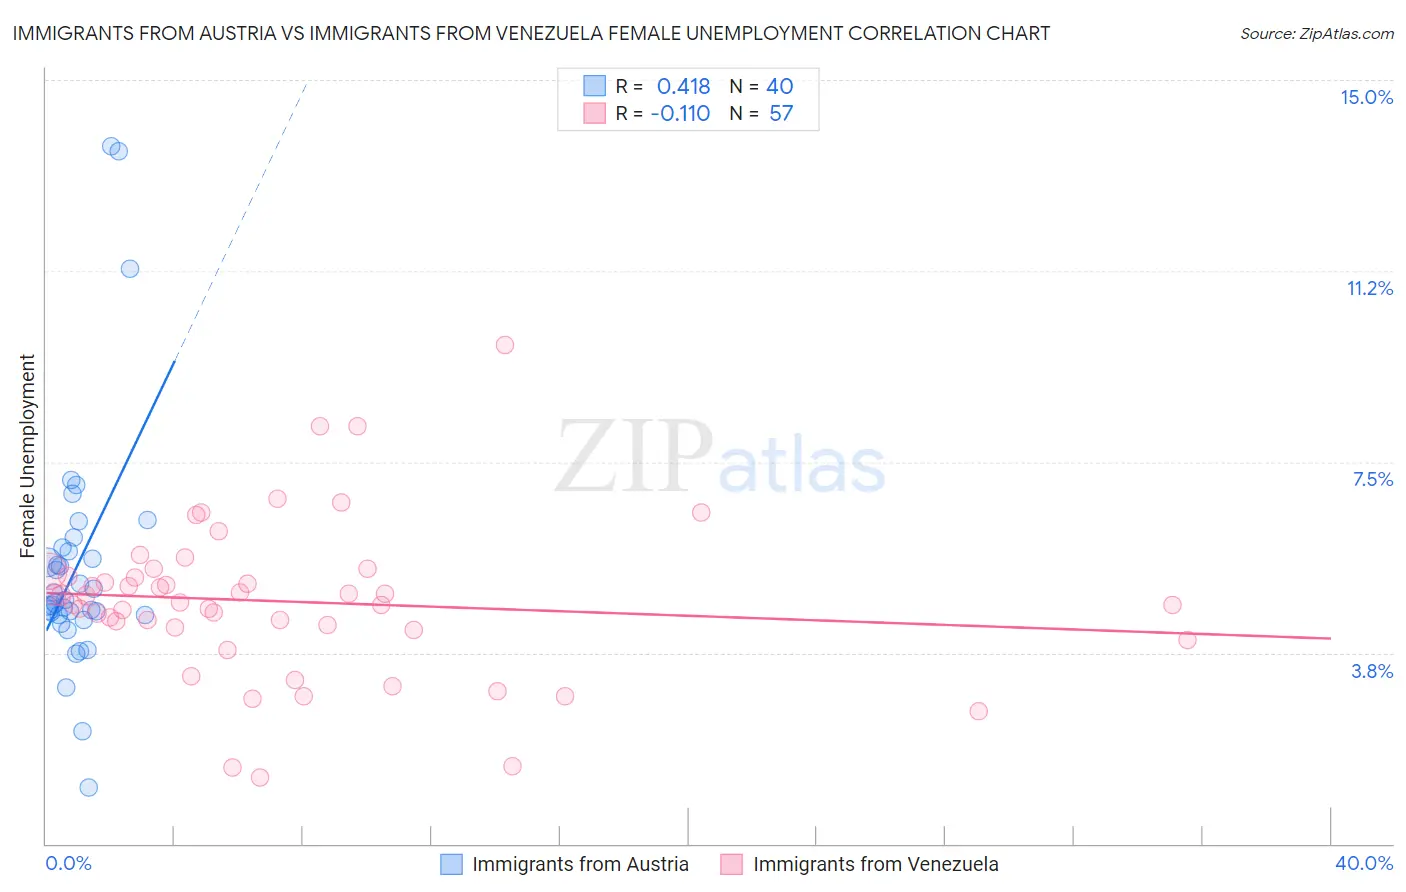
Immigrants from Austria vs Immigrants from Venezuela Female Unemployment Correlation Chart
The statistical analysis conducted on geographies consisting of 167,645,945 people shows a moderate positive correlation between the proportion of Immigrants from Austria and unemploymnet rate among females in the United States with a correlation coefficient (R) of 0.418 and weighted average of 5.0%. Similarly, the statistical analysis conducted on geographies consisting of 287,321,632 people shows a poor negative correlation between the proportion of Immigrants from Venezuela and unemploymnet rate among females in the United States with a correlation coefficient (R) of -0.110 and weighted average of 5.0%, a difference of 1.2%.
Female Unemployment Correlation Summary
| Measurement | Immigrants from Austria | Immigrants from Venezuela |
| Minimum | 1.1% | 1.3% |
| Maximum | 13.7% | 9.8% |
| Range | 12.6% | 8.5% |
| Mean | 5.5% | 4.8% |
| Median | 4.8% | 4.7% |
| Interquartile 25% (IQ1) | 4.5% | 4.2% |
| Interquartile 75% (IQ3) | 5.8% | 5.3% |
| Interquartile Range (IQR) | 1.3% | 1.1% |
| Standard Deviation (Sample) | 2.5% | 1.5% |
| Standard Deviation (Population) | 2.4% | 1.5% |
Demographics Similar to Immigrants from Austria and Immigrants from Venezuela by Female Unemployment
In terms of female unemployment, the demographic groups most similar to Immigrants from Austria are Immigrants from Malaysia (5.0%, a difference of 0.020%), Romanian (5.0%, a difference of 0.080%), Immigrants from Japan (5.0%, a difference of 0.10%), Immigrants from Sweden (5.0%, a difference of 0.22%), and Immigrants from Taiwan (5.0%, a difference of 0.39%). Similarly, the demographic groups most similar to Immigrants from Venezuela are Immigrants from Singapore (5.0%, a difference of 0.010%), Immigrants from Bolivia (5.0%, a difference of 0.030%), Mongolian (5.0%, a difference of 0.090%), Immigrants from Netherlands (5.0%, a difference of 0.090%), and Turkish (5.0%, a difference of 0.28%).
| Demographics | Rating | Rank | Female Unemployment |
| Immigrants | Bolivia | 98.0 /100 | #74 | Exceptional 5.0% |
| Immigrants | Singapore | 98.0 /100 | #75 | Exceptional 5.0% |
| Immigrants | Venezuela | 97.9 /100 | #76 | Exceptional 5.0% |
| Mongolians | 97.8 /100 | #77 | Exceptional 5.0% |
| Immigrants | Netherlands | 97.8 /100 | #78 | Exceptional 5.0% |
| Turks | 97.6 /100 | #79 | Exceptional 5.0% |
| New Zealanders | 97.4 /100 | #80 | Exceptional 5.0% |
| Filipinos | 97.3 /100 | #81 | Exceptional 5.0% |
| Immigrants | Australia | 97.3 /100 | #82 | Exceptional 5.0% |
| Immigrants | Serbia | 97.2 /100 | #83 | Exceptional 5.0% |
| Canadians | 97.2 /100 | #84 | Exceptional 5.0% |
| Ukrainians | 97.1 /100 | #85 | Exceptional 5.0% |
| Bolivians | 97.1 /100 | #86 | Exceptional 5.0% |
| Venezuelans | 96.9 /100 | #87 | Exceptional 5.0% |
| Immigrants | Sudan | 96.7 /100 | #88 | Exceptional 5.0% |
| Immigrants | Taiwan | 96.6 /100 | #89 | Exceptional 5.0% |
| Immigrants | Sweden | 96.3 /100 | #90 | Exceptional 5.0% |
| Immigrants | Japan | 96.0 /100 | #91 | Exceptional 5.0% |
| Romanians | 95.9 /100 | #92 | Exceptional 5.0% |
| Immigrants | Austria | 95.7 /100 | #93 | Exceptional 5.0% |
| Immigrants | Malaysia | 95.7 /100 | #94 | Exceptional 5.0% |