Immigrants from Australia vs Slovene Unemployment Among Ages 25 to 29 years
COMPARE
Immigrants from Australia
Slovene
Unemployment Among Ages 25 to 29 years
Unemployment Among Ages 25 to 29 years Comparison
Immigrants from Australia
Slovenes
6.2%
UNEMPLOYMENT AMONG AGES 25 TO 29 YEARS
99.0/ 100
METRIC RATING
48th/ 347
METRIC RANK
6.3%
UNEMPLOYMENT AMONG AGES 25 TO 29 YEARS
95.3/ 100
METRIC RATING
83rd/ 347
METRIC RANK
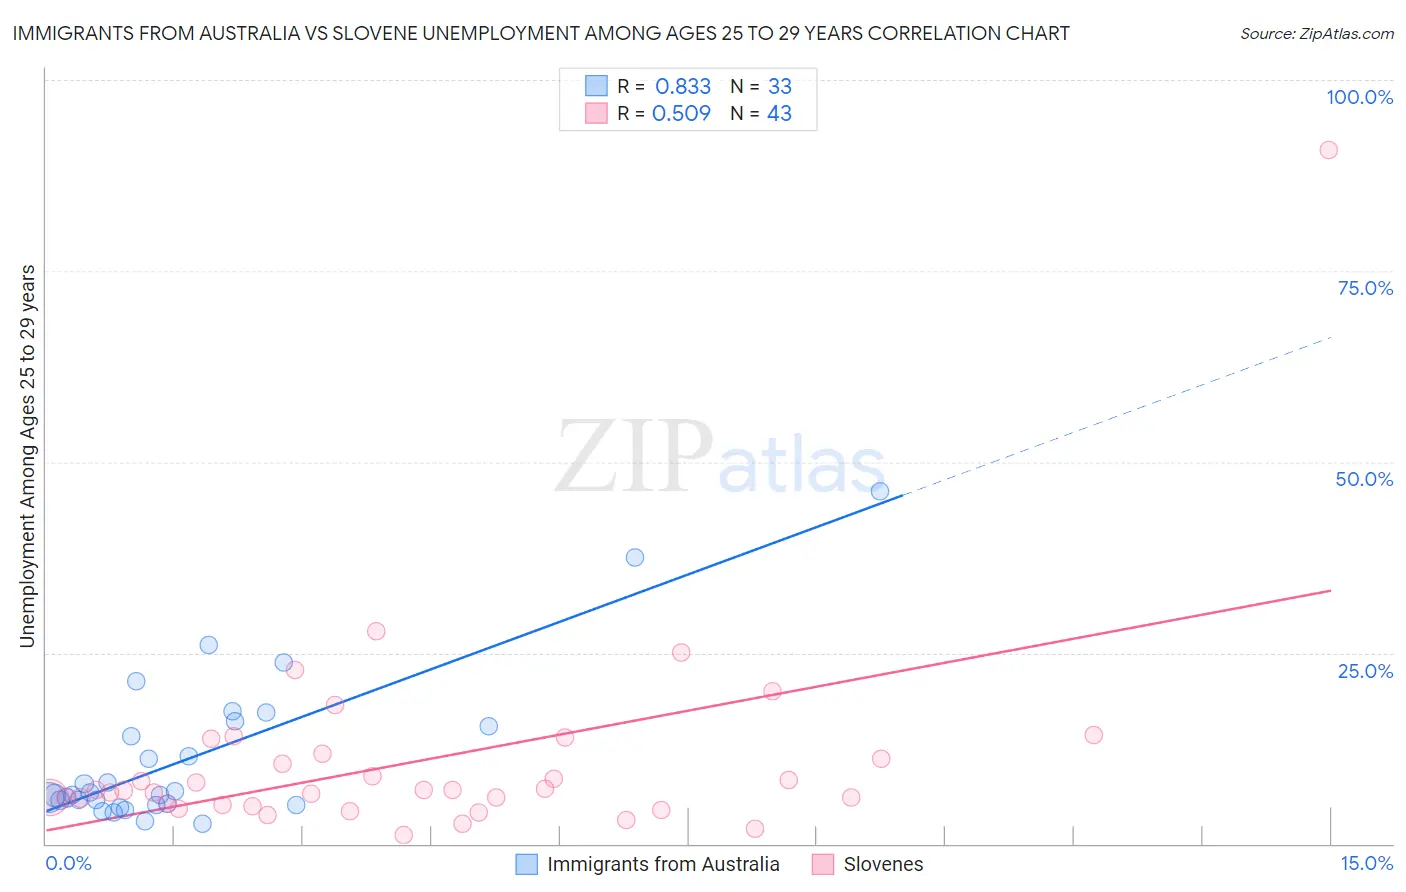
Immigrants from Australia vs Slovene Unemployment Among Ages 25 to 29 years Correlation Chart
The statistical analysis conducted on geographies consisting of 219,503,985 people shows a very strong positive correlation between the proportion of Immigrants from Australia and unemployment rate among population between the ages 25 and 29 in the United States with a correlation coefficient (R) of 0.833 and weighted average of 6.2%. Similarly, the statistical analysis conducted on geographies consisting of 249,419,398 people shows a substantial positive correlation between the proportion of Slovenes and unemployment rate among population between the ages 25 and 29 in the United States with a correlation coefficient (R) of 0.509 and weighted average of 6.3%, a difference of 2.6%.
Unemployment Among Ages 25 to 29 years Correlation Summary
| Measurement | Immigrants from Australia | Slovene |
| Minimum | 2.6% | 1.2% |
| Maximum | 46.2% | 90.9% |
| Range | 43.6% | 89.7% |
| Mean | 11.3% | 10.9% |
| Median | 6.5% | 7.1% |
| Interquartile 25% (IQ1) | 5.2% | 5.0% |
| Interquartile 75% (IQ3) | 15.8% | 11.8% |
| Interquartile Range (IQR) | 10.5% | 6.7% |
| Standard Deviation (Sample) | 10.0% | 13.9% |
| Standard Deviation (Population) | 9.9% | 13.7% |
Similar Demographics by Unemployment Among Ages 25 to 29 years
Demographics Similar to Immigrants from Australia by Unemployment Among Ages 25 to 29 years
In terms of unemployment among ages 25 to 29 years, the demographic groups most similar to Immigrants from Australia are Latvian (6.2%, a difference of 0.010%), Immigrants from Lithuania (6.2%, a difference of 0.030%), German Russian (6.2%, a difference of 0.070%), Venezuelan (6.2%, a difference of 0.11%), and Soviet Union (6.2%, a difference of 0.12%).
| Demographics | Rating | Rank | Unemployment Among Ages 25 to 29 years |
| Fijians | 99.3 /100 | #41 | Exceptional 6.1% |
| Jordanians | 99.3 /100 | #42 | Exceptional 6.1% |
| Czechs | 99.2 /100 | #43 | Exceptional 6.2% |
| Mongolians | 99.2 /100 | #44 | Exceptional 6.2% |
| Venezuelans | 99.1 /100 | #45 | Exceptional 6.2% |
| Immigrants | Lithuania | 99.0 /100 | #46 | Exceptional 6.2% |
| Latvians | 99.0 /100 | #47 | Exceptional 6.2% |
| Immigrants | Australia | 99.0 /100 | #48 | Exceptional 6.2% |
| German Russians | 99.0 /100 | #49 | Exceptional 6.2% |
| Soviet Union | 98.9 /100 | #50 | Exceptional 6.2% |
| Burmese | 98.9 /100 | #51 | Exceptional 6.2% |
| Immigrants | Turkey | 98.9 /100 | #52 | Exceptional 6.2% |
| Turks | 98.8 /100 | #53 | Exceptional 6.2% |
| Swedes | 98.8 /100 | #54 | Exceptional 6.2% |
| Immigrants | Netherlands | 98.7 /100 | #55 | Exceptional 6.2% |
Demographics Similar to Slovenes by Unemployment Among Ages 25 to 29 years
In terms of unemployment among ages 25 to 29 years, the demographic groups most similar to Slovenes are Immigrants from Spain (6.3%, a difference of 0.040%), Immigrants from Sweden (6.3%, a difference of 0.060%), Immigrants from Poland (6.3%, a difference of 0.13%), Immigrants from Asia (6.3%, a difference of 0.16%), and Iranian (6.3%, a difference of 0.17%).
| Demographics | Rating | Rank | Unemployment Among Ages 25 to 29 years |
| Immigrants | Korea | 96.7 /100 | #76 | Exceptional 6.3% |
| Icelanders | 96.6 /100 | #77 | Exceptional 6.3% |
| Asians | 96.4 /100 | #78 | Exceptional 6.3% |
| Immigrants | Switzerland | 96.0 /100 | #79 | Exceptional 6.3% |
| Immigrants | Romania | 95.9 /100 | #80 | Exceptional 6.3% |
| Iranians | 95.8 /100 | #81 | Exceptional 6.3% |
| Immigrants | Poland | 95.7 /100 | #82 | Exceptional 6.3% |
| Slovenes | 95.3 /100 | #83 | Exceptional 6.3% |
| Immigrants | Spain | 95.2 /100 | #84 | Exceptional 6.3% |
| Immigrants | Sweden | 95.1 /100 | #85 | Exceptional 6.3% |
| Immigrants | Asia | 94.9 /100 | #86 | Exceptional 6.3% |
| Marshallese | 94.7 /100 | #87 | Exceptional 6.4% |
| Immigrants | Indonesia | 94.5 /100 | #88 | Exceptional 6.4% |
| Immigrants | Oceania | 94.1 /100 | #89 | Exceptional 6.4% |
| Lebanese | 93.9 /100 | #90 | Exceptional 6.4% |