Immigrants from Asia vs Immigrants from Dominica Unemployment Among Seniors over 75 years
COMPARE
Immigrants from Asia
Immigrants from Dominica
Unemployment Among Seniors over 75 years
Unemployment Among Seniors over 75 years Comparison
Immigrants from Asia
Immigrants from Dominica
8.3%
UNEMPLOYMENT AMONG SENIORS OVER 75 YEARS
97.4/ 100
METRIC RATING
120th/ 347
METRIC RANK
9.8%
UNEMPLOYMENT AMONG SENIORS OVER 75 YEARS
0.0/ 100
METRIC RATING
294th/ 347
METRIC RANK
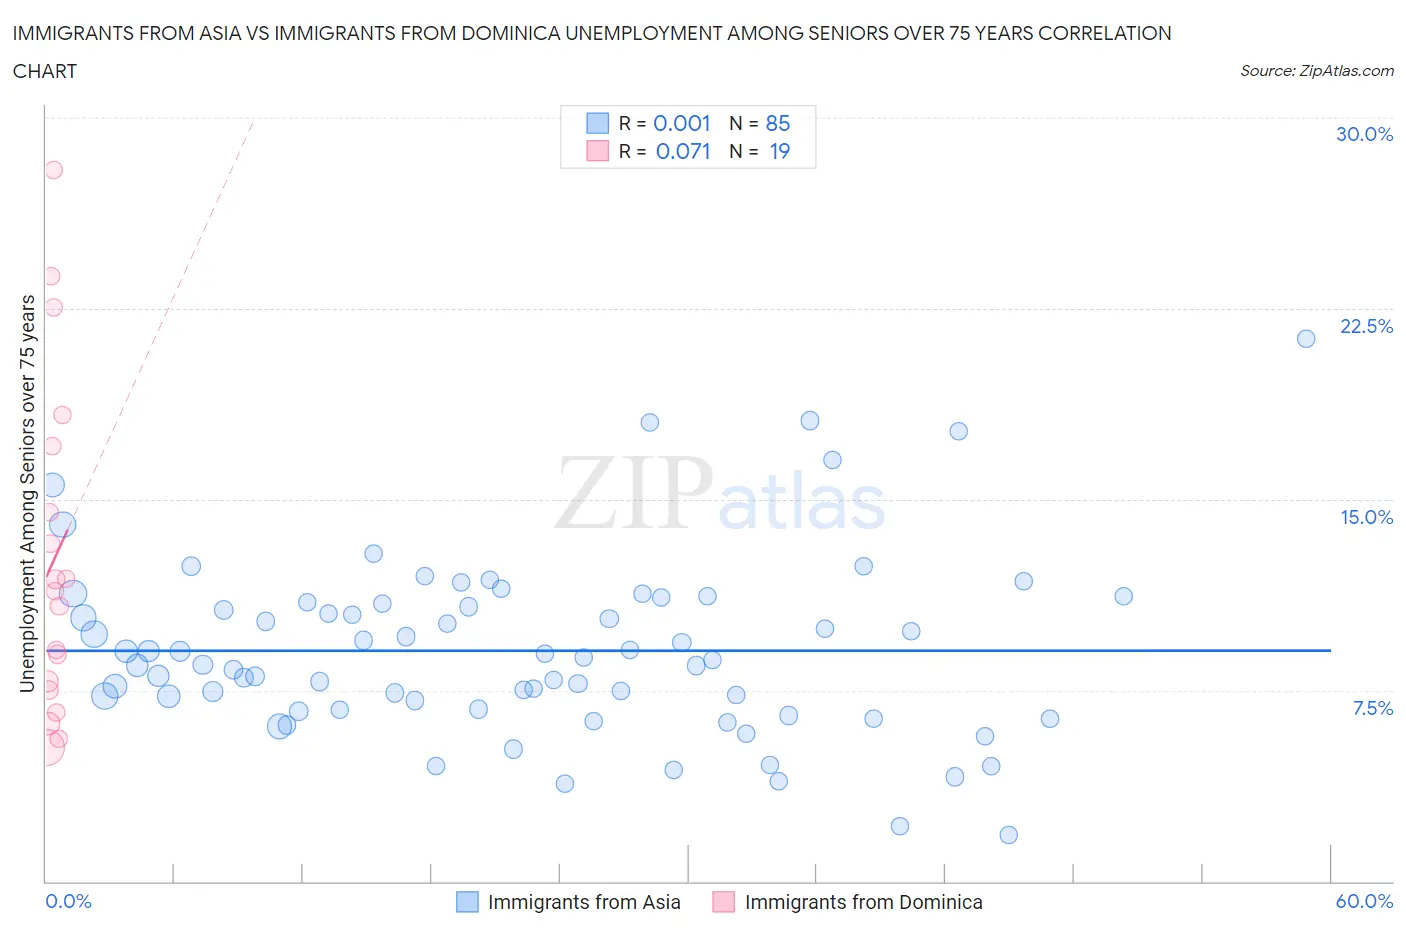
Immigrants from Asia vs Immigrants from Dominica Unemployment Among Seniors over 75 years Correlation Chart
The statistical analysis conducted on geographies consisting of 233,655,356 people shows no correlation between the proportion of Immigrants from Asia and unemployment rate among seniors over the age of 75 in the United States with a correlation coefficient (R) of 0.001 and weighted average of 8.3%. Similarly, the statistical analysis conducted on geographies consisting of 63,250,928 people shows a slight positive correlation between the proportion of Immigrants from Dominica and unemployment rate among seniors over the age of 75 in the United States with a correlation coefficient (R) of 0.071 and weighted average of 9.8%, a difference of 17.7%.
Unemployment Among Seniors over 75 years Correlation Summary
| Measurement | Immigrants from Asia | Immigrants from Dominica |
| Minimum | 1.8% | 5.3% |
| Maximum | 21.3% | 27.9% |
| Range | 19.5% | 22.7% |
| Mean | 9.1% | 12.7% |
| Median | 8.7% | 11.4% |
| Interquartile 25% (IQ1) | 6.7% | 7.5% |
| Interquartile 75% (IQ3) | 10.9% | 17.1% |
| Interquartile Range (IQR) | 4.2% | 9.6% |
| Standard Deviation (Sample) | 3.5% | 6.6% |
| Standard Deviation (Population) | 3.5% | 6.4% |
Similar Demographics by Unemployment Among Seniors over 75 years
Demographics Similar to Immigrants from Asia by Unemployment Among Seniors over 75 years
In terms of unemployment among seniors over 75 years, the demographic groups most similar to Immigrants from Asia are Japanese (8.3%, a difference of 0.020%), Immigrants from Croatia (8.3%, a difference of 0.13%), Immigrants from Russia (8.3%, a difference of 0.20%), Immigrants from Nepal (8.3%, a difference of 0.27%), and Immigrants from Middle Africa (8.3%, a difference of 0.29%).
| Demographics | Rating | Rank | Unemployment Among Seniors over 75 years |
| Asians | 98.5 /100 | #113 | Exceptional 8.3% |
| Trinidadians and Tobagonians | 98.4 /100 | #114 | Exceptional 8.3% |
| Sudanese | 98.2 /100 | #115 | Exceptional 8.3% |
| Immigrants | West Indies | 98.1 /100 | #116 | Exceptional 8.3% |
| Immigrants | Greece | 97.9 /100 | #117 | Exceptional 8.3% |
| Immigrants | Middle Africa | 97.9 /100 | #118 | Exceptional 8.3% |
| Japanese | 97.5 /100 | #119 | Exceptional 8.3% |
| Immigrants | Asia | 97.4 /100 | #120 | Exceptional 8.3% |
| Immigrants | Croatia | 97.2 /100 | #121 | Exceptional 8.3% |
| Immigrants | Russia | 97.1 /100 | #122 | Exceptional 8.3% |
| Immigrants | Nepal | 96.9 /100 | #123 | Exceptional 8.3% |
| Thais | 96.8 /100 | #124 | Exceptional 8.3% |
| Immigrants | Moldova | 96.7 /100 | #125 | Exceptional 8.3% |
| Belizeans | 96.3 /100 | #126 | Exceptional 8.4% |
| Hondurans | 96.2 /100 | #127 | Exceptional 8.4% |
Demographics Similar to Immigrants from Dominica by Unemployment Among Seniors over 75 years
In terms of unemployment among seniors over 75 years, the demographic groups most similar to Immigrants from Dominica are Norwegian (9.8%, a difference of 0.060%), Immigrants from Western Africa (9.8%, a difference of 0.23%), Nonimmigrants (9.8%, a difference of 0.36%), Immigrants from St. Vincent and the Grenadines (9.8%, a difference of 0.41%), and Cherokee (9.8%, a difference of 0.50%).
| Demographics | Rating | Rank | Unemployment Among Seniors over 75 years |
| Danes | 0.0 /100 | #287 | Tragic 9.7% |
| Canadians | 0.0 /100 | #288 | Tragic 9.7% |
| Czechs | 0.0 /100 | #289 | Tragic 9.7% |
| Sioux | 0.0 /100 | #290 | Tragic 9.7% |
| Scandinavians | 0.0 /100 | #291 | Tragic 9.7% |
| Immigrants | Western Africa | 0.0 /100 | #292 | Tragic 9.8% |
| Norwegians | 0.0 /100 | #293 | Tragic 9.8% |
| Immigrants | Dominica | 0.0 /100 | #294 | Tragic 9.8% |
| Immigrants | Nonimmigrants | 0.0 /100 | #295 | Tragic 9.8% |
| Immigrants | St. Vincent and the Grenadines | 0.0 /100 | #296 | Tragic 9.8% |
| Cherokee | 0.0 /100 | #297 | Tragic 9.8% |
| Lithuanians | 0.0 /100 | #298 | Tragic 9.9% |
| Belgians | 0.0 /100 | #299 | Tragic 9.9% |
| Iraqis | 0.0 /100 | #300 | Tragic 9.9% |
| Welsh | 0.0 /100 | #301 | Tragic 10.0% |