Immigrants from Armenia vs Immigrants Male Unemployment
COMPARE
Immigrants from Armenia
Immigrants
Male Unemployment
Male Unemployment Comparison
Immigrants from Armenia
Immigrants
6.9%
MALE UNEMPLOYMENT
0.0/ 100
METRIC RATING
311th/ 347
METRIC RANK
5.5%
MALE UNEMPLOYMENT
4.3/ 100
METRIC RATING
216th/ 347
METRIC RANK
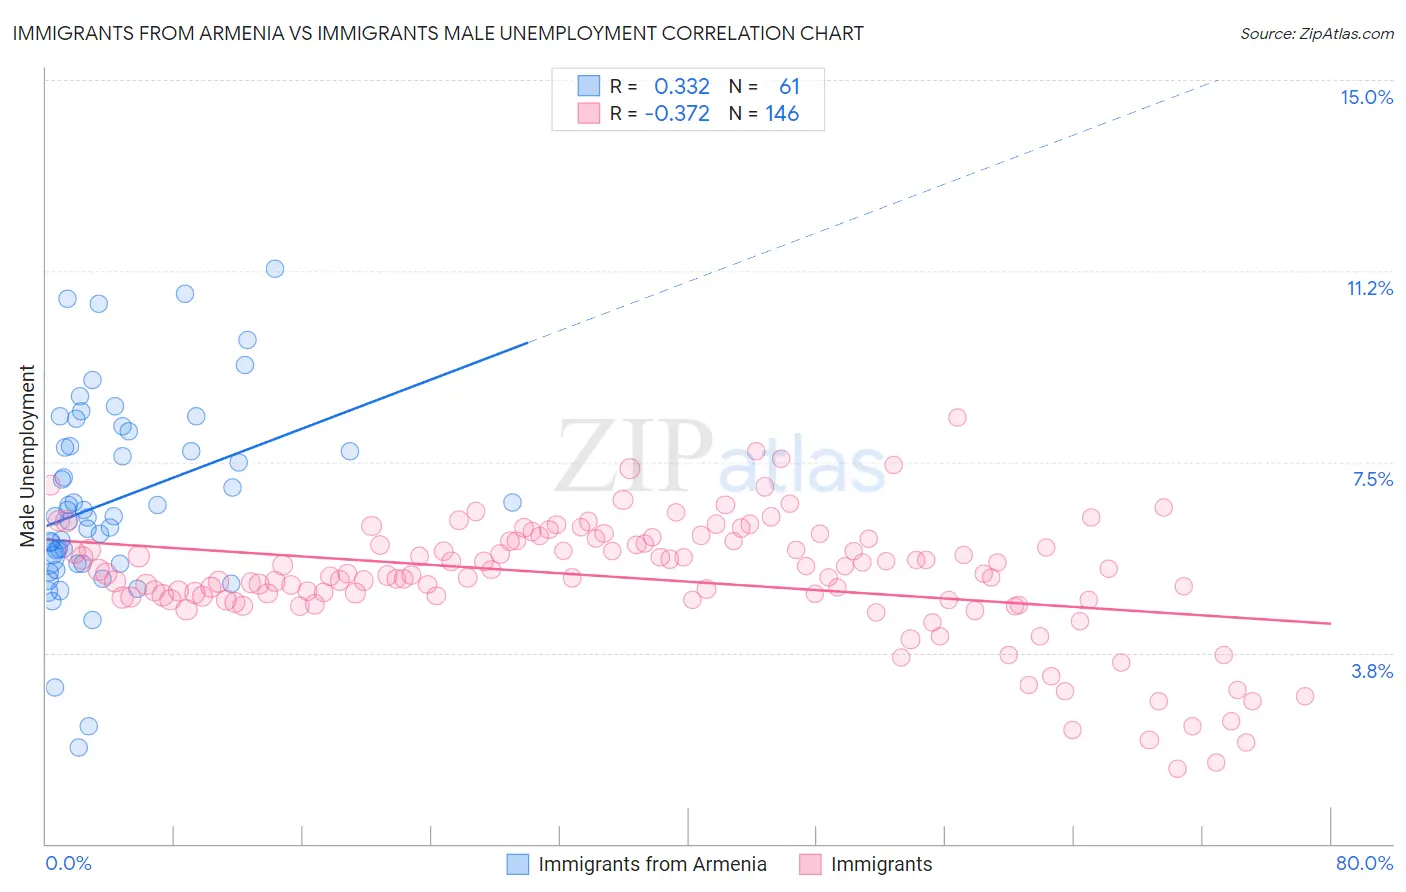
Immigrants from Armenia vs Immigrants Male Unemployment Correlation Chart
The statistical analysis conducted on geographies consisting of 97,668,427 people shows a mild positive correlation between the proportion of Immigrants from Armenia and unemployment rate among males in the United States with a correlation coefficient (R) of 0.332 and weighted average of 6.9%. Similarly, the statistical analysis conducted on geographies consisting of 566,323,513 people shows a mild negative correlation between the proportion of Immigrants and unemployment rate among males in the United States with a correlation coefficient (R) of -0.372 and weighted average of 5.5%, a difference of 25.1%.
Male Unemployment Correlation Summary
| Measurement | Immigrants from Armenia | Immigrants |
| Minimum | 1.9% | 1.5% |
| Maximum | 11.3% | 8.4% |
| Range | 9.4% | 6.9% |
| Mean | 6.7% | 5.2% |
| Median | 6.4% | 5.3% |
| Interquartile 25% (IQ1) | 5.5% | 4.8% |
| Interquartile 75% (IQ3) | 8.0% | 5.9% |
| Interquartile Range (IQR) | 2.4% | 1.1% |
| Standard Deviation (Sample) | 1.9% | 1.2% |
| Standard Deviation (Population) | 1.9% | 1.2% |
Similar Demographics by Male Unemployment
Demographics Similar to Immigrants from Armenia by Male Unemployment
In terms of male unemployment, the demographic groups most similar to Immigrants from Armenia are Lumbee (6.9%, a difference of 0.20%), Black/African American (6.9%, a difference of 0.31%), Barbadian (6.9%, a difference of 0.96%), Immigrants from Dominica (7.0%, a difference of 1.2%), and Aleut (6.8%, a difference of 1.4%).
| Demographics | Rating | Rank | Male Unemployment |
| West Indians | 0.0 /100 | #304 | Tragic 6.7% |
| Trinidadians and Tobagonians | 0.0 /100 | #305 | Tragic 6.7% |
| Immigrants | Trinidad and Tobago | 0.0 /100 | #306 | Tragic 6.7% |
| Immigrants | Jamaica | 0.0 /100 | #307 | Tragic 6.7% |
| Aleuts | 0.0 /100 | #308 | Tragic 6.8% |
| Barbadians | 0.0 /100 | #309 | Tragic 6.9% |
| Blacks/African Americans | 0.0 /100 | #310 | Tragic 6.9% |
| Immigrants | Armenia | 0.0 /100 | #311 | Tragic 6.9% |
| Lumbee | 0.0 /100 | #312 | Tragic 6.9% |
| Immigrants | Dominica | 0.0 /100 | #313 | Tragic 7.0% |
| Immigrants | Barbados | 0.0 /100 | #314 | Tragic 7.1% |
| Houma | 0.0 /100 | #315 | Tragic 7.1% |
| Immigrants | Guyana | 0.0 /100 | #316 | Tragic 7.1% |
| Guyanese | 0.0 /100 | #317 | Tragic 7.1% |
| Cape Verdeans | 0.0 /100 | #318 | Tragic 7.1% |
Demographics Similar to Immigrants by Male Unemployment
In terms of male unemployment, the demographic groups most similar to Immigrants are Delaware (5.5%, a difference of 0.050%), Samoan (5.5%, a difference of 0.17%), Immigrants from Albania (5.5%, a difference of 0.26%), Immigrants from Western Asia (5.6%, a difference of 0.31%), and Portuguese (5.6%, a difference of 0.33%).
| Demographics | Rating | Rank | Male Unemployment |
| Immigrants | Middle Africa | 8.3 /100 | #209 | Tragic 5.5% |
| South American Indians | 7.6 /100 | #210 | Tragic 5.5% |
| Israelis | 7.4 /100 | #211 | Tragic 5.5% |
| Hmong | 7.0 /100 | #212 | Tragic 5.5% |
| Ugandans | 6.3 /100 | #213 | Tragic 5.5% |
| Puget Sound Salish | 5.6 /100 | #214 | Tragic 5.5% |
| Samoans | 4.9 /100 | #215 | Tragic 5.5% |
| Immigrants | Immigrants | 4.3 /100 | #216 | Tragic 5.5% |
| Delaware | 4.2 /100 | #217 | Tragic 5.5% |
| Immigrants | Albania | 3.6 /100 | #218 | Tragic 5.5% |
| Immigrants | Western Asia | 3.5 /100 | #219 | Tragic 5.6% |
| Portuguese | 3.5 /100 | #220 | Tragic 5.6% |
| Soviet Union | 3.2 /100 | #221 | Tragic 5.6% |
| Immigrants | Micronesia | 2.9 /100 | #222 | Tragic 5.6% |
| Creek | 2.6 /100 | #223 | Tragic 5.6% |