Immigrants from Armenia vs Immigrants from Israel Unemployment Among Women with Children Ages 6 to 17 years
COMPARE
Immigrants from Armenia
Immigrants from Israel
Unemployment Among Women with Children Ages 6 to 17 years
Unemployment Among Women with Children Ages 6 to 17 years Comparison
Immigrants from Armenia
Immigrants from Israel
8.2%
UNEMPLOYMENT AMONG WOMEN WITH CHILDREN AGES 6 TO 17 YEARS
100.0/ 100
METRIC RATING
54th/ 347
METRIC RANK
8.5%
UNEMPLOYMENT AMONG WOMEN WITH CHILDREN AGES 6 TO 17 YEARS
99.1/ 100
METRIC RATING
87th/ 347
METRIC RANK
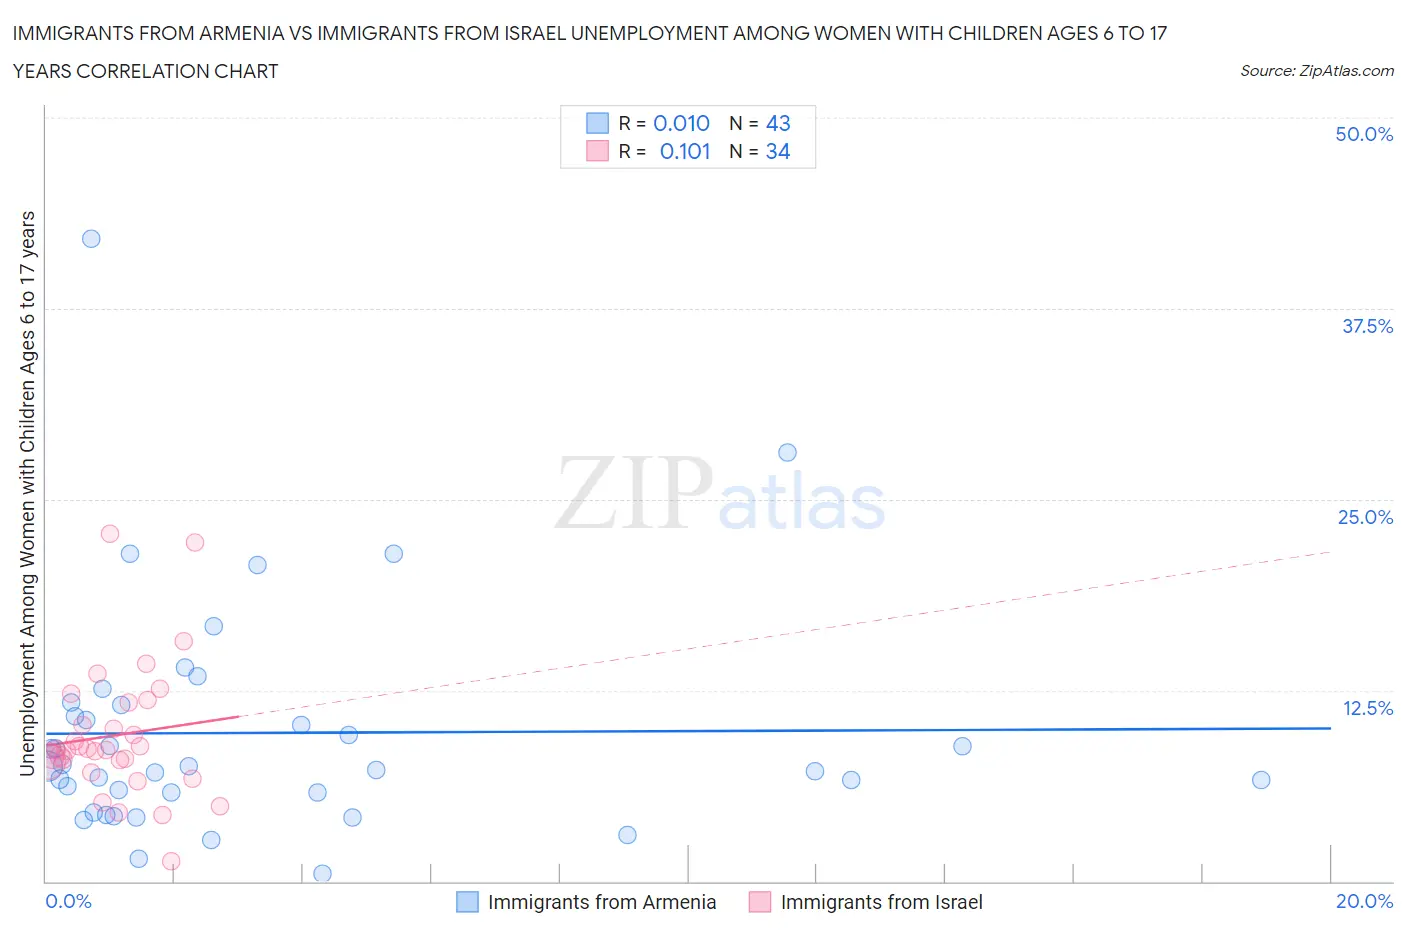
Immigrants from Armenia vs Immigrants from Israel Unemployment Among Women with Children Ages 6 to 17 years Correlation Chart
The statistical analysis conducted on geographies consisting of 85,380,605 people shows no correlation between the proportion of Immigrants from Armenia and unemployment rate among women with children between the ages 6 and 17 in the United States with a correlation coefficient (R) of 0.010 and weighted average of 8.2%. Similarly, the statistical analysis conducted on geographies consisting of 166,050,756 people shows a poor positive correlation between the proportion of Immigrants from Israel and unemployment rate among women with children between the ages 6 and 17 in the United States with a correlation coefficient (R) of 0.101 and weighted average of 8.5%, a difference of 4.1%.
Unemployment Among Women with Children Ages 6 to 17 years Correlation Summary
| Measurement | Immigrants from Armenia | Immigrants from Israel |
| Minimum | 0.50% | 1.3% |
| Maximum | 42.1% | 22.7% |
| Range | 41.6% | 21.4% |
| Mean | 9.7% | 9.6% |
| Median | 7.6% | 8.6% |
| Interquartile 25% (IQ1) | 5.8% | 7.8% |
| Interquartile 75% (IQ3) | 11.5% | 11.7% |
| Interquartile Range (IQR) | 5.7% | 3.9% |
| Standard Deviation (Sample) | 7.6% | 4.4% |
| Standard Deviation (Population) | 7.5% | 4.3% |
Similar Demographics by Unemployment Among Women with Children Ages 6 to 17 years
Demographics Similar to Immigrants from Armenia by Unemployment Among Women with Children Ages 6 to 17 years
In terms of unemployment among women with children ages 6 to 17 years, the demographic groups most similar to Immigrants from Armenia are Immigrants from Japan (8.2%, a difference of 0.060%), Immigrants from Bosnia and Herzegovina (8.2%, a difference of 0.070%), Immigrants from Laos (8.2%, a difference of 0.10%), Danish (8.1%, a difference of 0.22%), and Immigrants from Iraq (8.1%, a difference of 0.29%).
| Demographics | Rating | Rank | Unemployment Among Women with Children Ages 6 to 17 years |
| Immigrants | Switzerland | 100.0 /100 | #47 | Exceptional 8.1% |
| Immigrants | Asia | 100.0 /100 | #48 | Exceptional 8.1% |
| Immigrants | Oceania | 100.0 /100 | #49 | Exceptional 8.1% |
| Hawaiians | 100.0 /100 | #50 | Exceptional 8.1% |
| Immigrants | Sudan | 100.0 /100 | #51 | Exceptional 8.1% |
| Immigrants | Iraq | 100.0 /100 | #52 | Exceptional 8.1% |
| Danes | 100.0 /100 | #53 | Exceptional 8.1% |
| Immigrants | Armenia | 100.0 /100 | #54 | Exceptional 8.2% |
| Immigrants | Japan | 100.0 /100 | #55 | Exceptional 8.2% |
| Immigrants | Bosnia and Herzegovina | 100.0 /100 | #56 | Exceptional 8.2% |
| Immigrants | Laos | 100.0 /100 | #57 | Exceptional 8.2% |
| Immigrants | Malaysia | 100.0 /100 | #58 | Exceptional 8.2% |
| Immigrants | Philippines | 100.0 /100 | #59 | Exceptional 8.2% |
| Basques | 100.0 /100 | #60 | Exceptional 8.2% |
| Koreans | 100.0 /100 | #61 | Exceptional 8.2% |
Demographics Similar to Immigrants from Israel by Unemployment Among Women with Children Ages 6 to 17 years
In terms of unemployment among women with children ages 6 to 17 years, the demographic groups most similar to Immigrants from Israel are Immigrants from Vietnam (8.5%, a difference of 0.020%), Paiute (8.5%, a difference of 0.10%), Yugoslavian (8.5%, a difference of 0.13%), Immigrants from Eastern Europe (8.5%, a difference of 0.20%), and Potawatomi (8.5%, a difference of 0.22%).
| Demographics | Rating | Rank | Unemployment Among Women with Children Ages 6 to 17 years |
| Immigrants | Belarus | 99.6 /100 | #80 | Exceptional 8.4% |
| Immigrants | Bolivia | 99.6 /100 | #81 | Exceptional 8.4% |
| Cypriots | 99.6 /100 | #82 | Exceptional 8.4% |
| Bulgarians | 99.5 /100 | #83 | Exceptional 8.4% |
| Japanese | 99.5 /100 | #84 | Exceptional 8.4% |
| Immigrants | North Macedonia | 99.4 /100 | #85 | Exceptional 8.5% |
| Alaskan Athabascans | 99.4 /100 | #86 | Exceptional 8.5% |
| Immigrants | Israel | 99.1 /100 | #87 | Exceptional 8.5% |
| Immigrants | Vietnam | 99.1 /100 | #88 | Exceptional 8.5% |
| Paiute | 99.1 /100 | #89 | Exceptional 8.5% |
| Yugoslavians | 99.0 /100 | #90 | Exceptional 8.5% |
| Immigrants | Eastern Europe | 99.0 /100 | #91 | Exceptional 8.5% |
| Potawatomi | 99.0 /100 | #92 | Exceptional 8.5% |
| Australians | 98.9 /100 | #93 | Exceptional 8.5% |
| Immigrants | Barbados | 98.8 /100 | #94 | Exceptional 8.5% |