Immigrants from Armenia vs Immigrants from Czechoslovakia Unemployment Among Ages 60 to 64 years

COMPARE

Immigrants from Armenia
Race
Ancestry
AfghanAfricanAlaska NativeAlaskan AthabascanAlbanianAleutAlsatianAmericanApacheArabArapahoArgentineanArmenianAssyrian/Chaldean/SyriacAustralianAustrianBahamianBangladeshiBarbadianBasqueBelgianBelizeanBermudanBhutaneseBlackfeetBolivianBrazilianBritishBritish West IndianBulgarianBurmeseCajunCambodianCanadianCape VerdeanCarpatho RusynCelticCentral AmericanCentral American IndianCherokeeCheyenneChickasawChileanChineseChippewaChoctawColombianColvilleComancheCosta RicanCreeCreekCroatianCrowCubanCypriotCzechCzechoslovakianDanishDelawareDominicanDutchDutch West IndianEastern EuropeanEcuadorianEgyptianEnglishEstonianEthiopianEuropeanFijianFilipinoFinnishFrenchFrench American IndianFrench CanadianGermanGerman RussianGhanaianGreekGuamanian/ChamorroGuatemalanGuyaneseHaitianHmongHonduranHopiHoumaHungarianIcelanderIndian (Asian)IndonesianInupiatIranianIraqiIrishIroquoisIsraeliItalianJamaicanJapaneseJordanianKenyanKiowaKoreanLaotianLatvianLebaneseLiberianLithuanianLumbeeLuxembourgerMacedonianMalaysianMalteseMarshalleseMenomineeMexicanMexican American IndianMongolianMoroccanNative HawaiianNavajoNepaleseNew ZealanderNicaraguanNigerianNorthern EuropeanNorwegianOkinawanOsageOttawaPaiutePakistaniPalestinianPanamanianParaguayanPennsylvania GermanPeruvianPimaPolishPortuguesePotawatomiPuebloPuerto RicanPuget Sound SalishRomanianRussianSalvadoranSamoanScandinavianScotch-IrishScottishSeminoleSenegaleseSerbianShoshoneSierra LeoneanSiouxSlavicSlovakSloveneSomaliSouth AfricanSouth AmericanSouth American IndianSoviet UnionSpaniardSpanishSpanish AmericanSpanish American IndianSri LankanSubsaharan AfricanSudaneseSwedishSwissSyrianTaiwaneseThaiTlingit-HaidaTohono O'OdhamTonganTrinidadian and TobagonianTsimshianTurkishU.S. Virgin IslanderUgandanUkrainianUruguayanUteVenezuelanVietnameseWelshWest IndianYakamaYaquiYugoslavianYumanYup'ikZimbabwean
Immigration
NonimmigrantsImmigrantsAfghanistanAfricaAlbaniaArgentinaArmeniaAsiaAustraliaAustriaBahamasBangladeshBarbadosBelarusBelgiumBelizeBoliviaBosnia and HerzegovinaBrazilBulgariaBurma/MyanmarCabo VerdeCambodiaCameroonCanadaCaribbeanCentral AmericaChileChinaColombiaCongoCosta RicaCroatiaCubaDenmarkDominicaDominican RepublicEastern AfricaEastern AsiaEastern EuropeEcuadorEgyptEl SalvadorEnglandEritreaEthiopiaEuropeFijiFranceGermanyGhanaGreeceGrenadaGuatemalaGuyanaHaitiHondurasHong KongHungaryIndiaIndonesiaIranIraqIrelandIsraelItalyJamaicaJapanJordanKazakhstanKenyaKoreaKuwaitLaosLatin AmericaLatviaLebanonLiberiaLithuaniaMalaysiaMexicoMicronesiaMiddle AfricaMoldovaMoroccoNepalNetherlandsNicaraguaNigeriaNorth AmericaNorth MacedoniaNorthern AfricaNorthern EuropeNorwayOceaniaPakistanPanamaPeruPhilippinesPolandPortugalRomaniaRussiaSaudi ArabiaScotlandSenegalSerbiaSierra LeoneSingaporeSomaliaSouth AfricaSouth AmericaSouth Central AsiaSouth Eastern AsiaSouthern EuropeSpainSri LankaSt. Vincent and the GrenadinesSudanSwedenSwitzerlandSyriaTaiwanThailandTrinidad and TobagoTurkeyUgandaUkraineUruguayUzbekistanVenezuelaVietnamWest IndiesWestern AfricaWestern AsiaWestern EuropeYemenZaireZimbabweAzores
Immigrants from Czechoslovakia
Race
Ancestry
AfghanAfricanAlaska NativeAlaskan AthabascanAlbanianAleutAlsatianAmericanApacheArabArapahoArgentineanArmenianAssyrian/Chaldean/SyriacAustralianAustrianBahamianBangladeshiBarbadianBasqueBelgianBelizeanBermudanBhutaneseBlackfeetBolivianBrazilianBritishBritish West IndianBulgarianBurmeseCajunCambodianCanadianCape VerdeanCarpatho RusynCelticCentral AmericanCentral American IndianCherokeeCheyenneChickasawChileanChineseChippewaChoctawColombianColvilleComancheCosta RicanCreeCreekCroatianCrowCubanCypriotCzechCzechoslovakianDanishDelawareDominicanDutchDutch West IndianEastern EuropeanEcuadorianEgyptianEnglishEstonianEthiopianEuropeanFijianFilipinoFinnishFrenchFrench American IndianFrench CanadianGermanGerman RussianGhanaianGreekGuamanian/ChamorroGuatemalanGuyaneseHaitianHmongHonduranHopiHoumaHungarianIcelanderIndian (Asian)IndonesianInupiatIranianIraqiIrishIroquoisIsraeliItalianJamaicanJapaneseJordanianKenyanKiowaKoreanLaotianLatvianLebaneseLiberianLithuanianLumbeeLuxembourgerMacedonianMalaysianMalteseMarshalleseMenomineeMexicanMexican American IndianMongolianMoroccanNative HawaiianNavajoNepaleseNew ZealanderNicaraguanNigerianNorthern EuropeanNorwegianOkinawanOsageOttawaPaiutePakistaniPalestinianPanamanianParaguayanPennsylvania GermanPeruvianPimaPolishPortuguesePotawatomiPuebloPuerto RicanPuget Sound SalishRomanianRussianSalvadoranSamoanScandinavianScotch-IrishScottishSeminoleSenegaleseSerbianShoshoneSierra LeoneanSiouxSlavicSlovakSloveneSomaliSouth AfricanSouth AmericanSouth American IndianSoviet UnionSpaniardSpanishSpanish AmericanSpanish American IndianSri LankanSubsaharan AfricanSudaneseSwedishSwissSyrianTaiwaneseThaiTlingit-HaidaTohono O'OdhamTonganTrinidadian and TobagonianTsimshianTurkishU.S. Virgin IslanderUgandanUkrainianUruguayanUteVenezuelanVietnameseWelshWest IndianYakamaYaquiYugoslavianYumanYup'ikZimbabwean
Immigration
NonimmigrantsImmigrantsAfghanistanAfricaAlbaniaArgentinaAsiaAustraliaAustriaBahamasBangladeshBarbadosBelarusBelgiumBelizeBoliviaBosnia and HerzegovinaBrazilBulgariaBurma/MyanmarCabo VerdeCambodiaCameroonCanadaCaribbeanCentral AmericaChileChinaColombiaCongoCosta RicaCroatiaCubaCzechoslovakiaDenmarkDominicaDominican RepublicEastern AfricaEastern AsiaEastern EuropeEcuadorEgyptEl SalvadorEnglandEritreaEthiopiaEuropeFijiFranceGermanyGhanaGreeceGrenadaGuatemalaGuyanaHaitiHondurasHong KongHungaryIndiaIndonesiaIranIraqIrelandIsraelItalyJamaicaJapanJordanKazakhstanKenyaKoreaKuwaitLaosLatin AmericaLatviaLebanonLiberiaLithuaniaMalaysiaMexicoMicronesiaMiddle AfricaMoldovaMoroccoNepalNetherlandsNicaraguaNigeriaNorth AmericaNorth MacedoniaNorthern AfricaNorthern EuropeNorwayOceaniaPakistanPanamaPeruPhilippinesPolandPortugalRomaniaRussiaSaudi ArabiaScotlandSenegalSerbiaSierra LeoneSingaporeSomaliaSouth AfricaSouth AmericaSouth Central AsiaSouth Eastern AsiaSouthern EuropeSpainSri LankaSt. Vincent and the GrenadinesSudanSwedenSwitzerlandSyriaTaiwanThailandTrinidad and TobagoTurkeyUgandaUkraineUruguayUzbekistanVenezuelaVietnamWest IndiesWestern AfricaWestern AsiaWestern EuropeYemenZaireZimbabweAzores
Unemployment Among Ages 60 to 64 years
Income
Poverty
Unemployment
Labor Participation
Family Structure
Vehicle Availability
Education Level
Disability

Unemployment Among Ages 60 to 64 years Comparison

Immigrants from Armenia

Immigrants from Czechoslovakia

Tragic
Fair
6.0%
UNEMPLOYMENT AMONG AGES 60 TO 64 YEARS
0.0/ 100
METRIC RATING
330th/ 347
METRIC RANK
4.9%
UNEMPLOYMENT AMONG AGES 60 TO 64 YEARS
23.5/ 100
METRIC RATING
200th/ 347
METRIC RANK

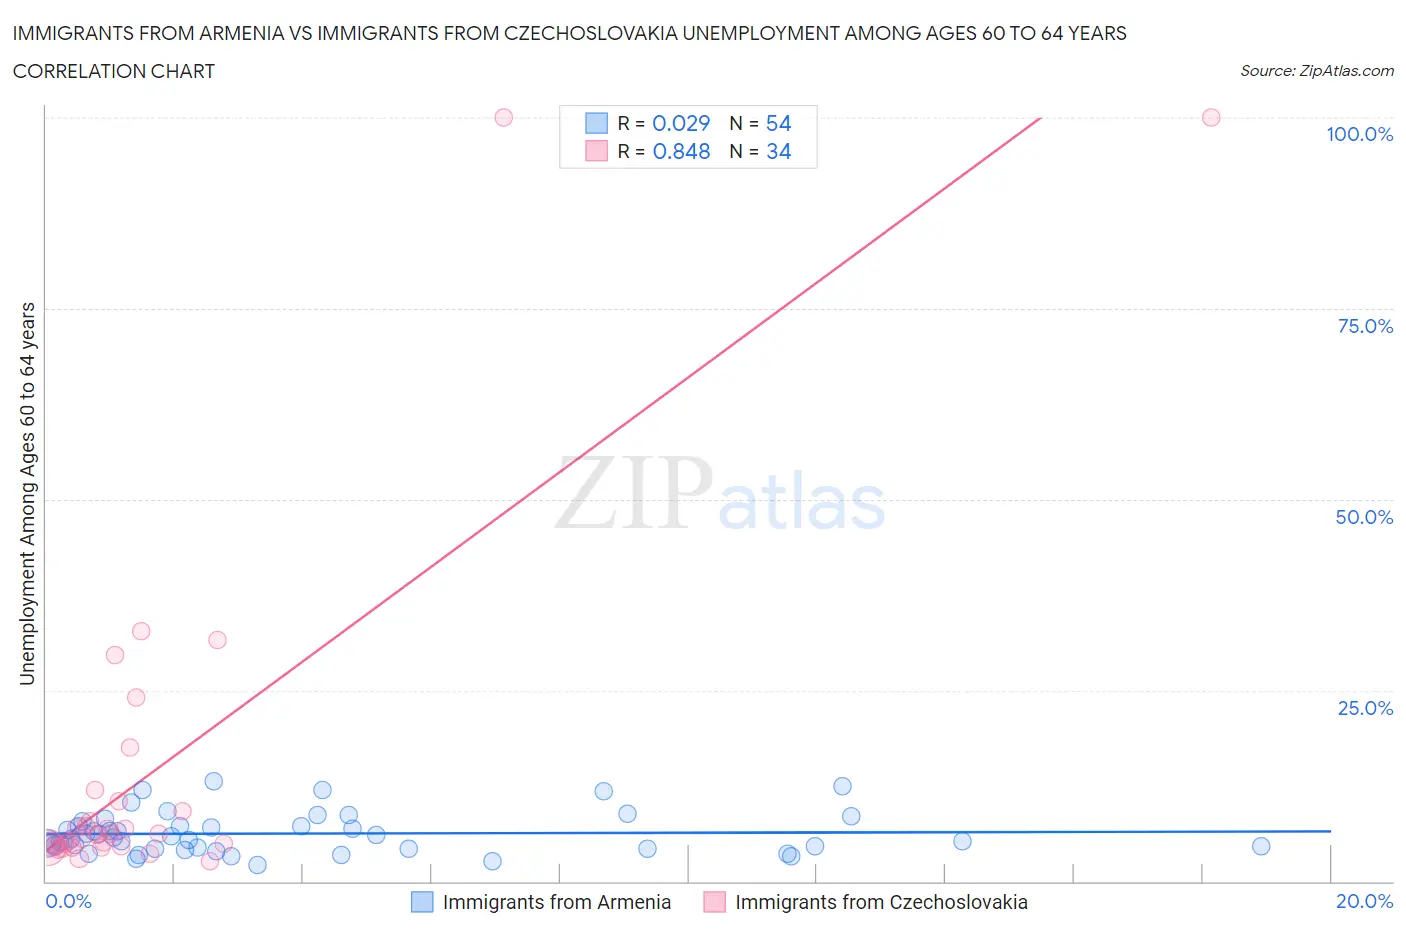
Immigrants from Armenia vs Immigrants from Czechoslovakia Unemployment Among Ages 60 to 64 years Correlation Chart

The statistical analysis conducted on geographies consisting of 95,885,845 people shows no correlation between the proportion of Immigrants from Armenia and unemployment rate among population between the ages 60 and 64 in the United States with a correlation coefficient (R) of 0.029 and weighted average of 6.0%. Similarly, the statistical analysis conducted on geographies consisting of 186,062,149 people shows a very strong positive correlation between the proportion of Immigrants from Czechoslovakia and unemployment rate among population between the ages 60 and 64 in the United States with a correlation coefficient (R) of 0.848 and weighted average of 4.9%, a difference of 21.6%.
Immigrants from Armenia vs Immigrants from Czechoslovakia Unemployment Among Ages 60 to 64 years

Unemployment Among Ages 60 to 64 years Correlation Summary

MeasurementImmigrants from ArmeniaImmigrants from Czechoslovakia
Minimum2.1%2.6%
Maximum13.1%100.0%
Range11.0%97.4%
Mean6.2%14.5%
Median5.7%6.1%
Interquartile 25% (IQ1)4.3%4.6%
Interquartile 75% (IQ3)7.2%10.4%
Interquartile Range (IQR)2.9%5.8%
Standard Deviation (Sample)2.7%23.2%
Standard Deviation (Population)2.6%22.8%

Similar Demographics by Unemployment Among Ages 60 to 64 years

Demographics Similar to Immigrants from Armenia by Unemployment Among Ages 60 to 64 years

In terms of unemployment among ages 60 to 64 years, the demographic groups most similar to Immigrants from Armenia are Yakama (6.0%, a difference of 0.14%), Dominican (6.0%, a difference of 0.16%), Immigrants from Bangladesh (6.0%, a difference of 0.26%), Apache (6.0%, a difference of 0.27%), and Immigrants from Dominican Republic (6.0%, a difference of 0.51%).
DemographicsRating | RankUnemployment Among Ages 60 to 64 years
Alsatians
0.0
/100
|
#323
Tragic
5.8%
Immigrants | Ecuador
0.0
/100
|
#324
Tragic
5.8%
Paiute
0.0
/100
|
#325
Tragic
5.8%
Immigrants | St. Vincent and the Grenadines
0.0
/100
|
#326
Tragic
5.9%
Immigrants | Grenada
0.0
/100
|
#327
Tragic
5.9%
Apache
0.0
/100
|
#328
Tragic
6.0%
Immigrants | Bangladesh
0.0
/100
|
#329
Tragic
6.0%
Immigrants | Armenia
0.0
/100
|
#330
Tragic
6.0%
Yakama
0.0
/100
|
#331
Tragic
6.0%
Dominicans
0.0
/100
|
#332
Tragic
6.0%
Immigrants | Dominican Republic
0.0
/100
|
#333
Tragic
6.0%
Puerto Ricans
0.0
/100
|
#334
Tragic
6.1%
Vietnamese
0.0
/100
|
#335
Tragic
6.1%
Kiowa
0.0
/100
|
#336
Tragic
6.2%
Navajo
0.0
/100
|
#337
Tragic
6.3%

Demographics Similar to Immigrants from Czechoslovakia by Unemployment Among Ages 60 to 64 years

In terms of unemployment among ages 60 to 64 years, the demographic groups most similar to Immigrants from Czechoslovakia are Guamanian/Chamorro (4.9%, a difference of 0.010%), Immigrants from Vietnam (4.9%, a difference of 0.010%), Colombian (4.9%, a difference of 0.040%), Immigrants from Eastern Europe (4.9%, a difference of 0.080%), and Immigrants from Asia (4.9%, a difference of 0.10%).
DemographicsRating | RankUnemployment Among Ages 60 to 64 years
Houma
28.3
/100
|
#193
Fair
4.9%
Immigrants | Colombia
26.8
/100
|
#194
Fair
4.9%
Immigrants | Austria
26.6
/100
|
#195
Fair
4.9%
Immigrants | Asia
25.7
/100
|
#196
Fair
4.9%
Immigrants | Eastern Europe
25.2
/100
|
#197
Fair
4.9%
Guamanians/Chamorros
23.7
/100
|
#198
Fair
4.9%
Immigrants | Vietnam
23.7
/100
|
#199
Fair
4.9%
Immigrants | Czechoslovakia
23.5
/100
|
#200
Fair
4.9%
Colombians
22.7
/100
|
#201
Fair
4.9%
Immigrants | Western Africa
20.6
/100
|
#202
Fair
4.9%
Uruguayans
19.9
/100
|
#203
Poor
4.9%
Russians
18.9
/100
|
#204
Poor
4.9%
Immigrants | Indonesia
17.4
/100
|
#205
Poor
4.9%
New Zealanders
17.4
/100
|
#206
Poor
4.9%
Chippewa
17.3
/100
|
#207
Poor
4.9%