Immigrants from Armenia vs Central American Indian Unemployment Among Ages 25 to 29 years
COMPARE
Immigrants from Armenia
Central American Indian
Unemployment Among Ages 25 to 29 years
Unemployment Among Ages 25 to 29 years Comparison
Immigrants from Armenia
Central American Indians
8.5%
UNEMPLOYMENT AMONG AGES 25 TO 29 YEARS
0.0/ 100
METRIC RATING
319th/ 347
METRIC RANK
7.9%
UNEMPLOYMENT AMONG AGES 25 TO 29 YEARS
0.0/ 100
METRIC RATING
300th/ 347
METRIC RANK
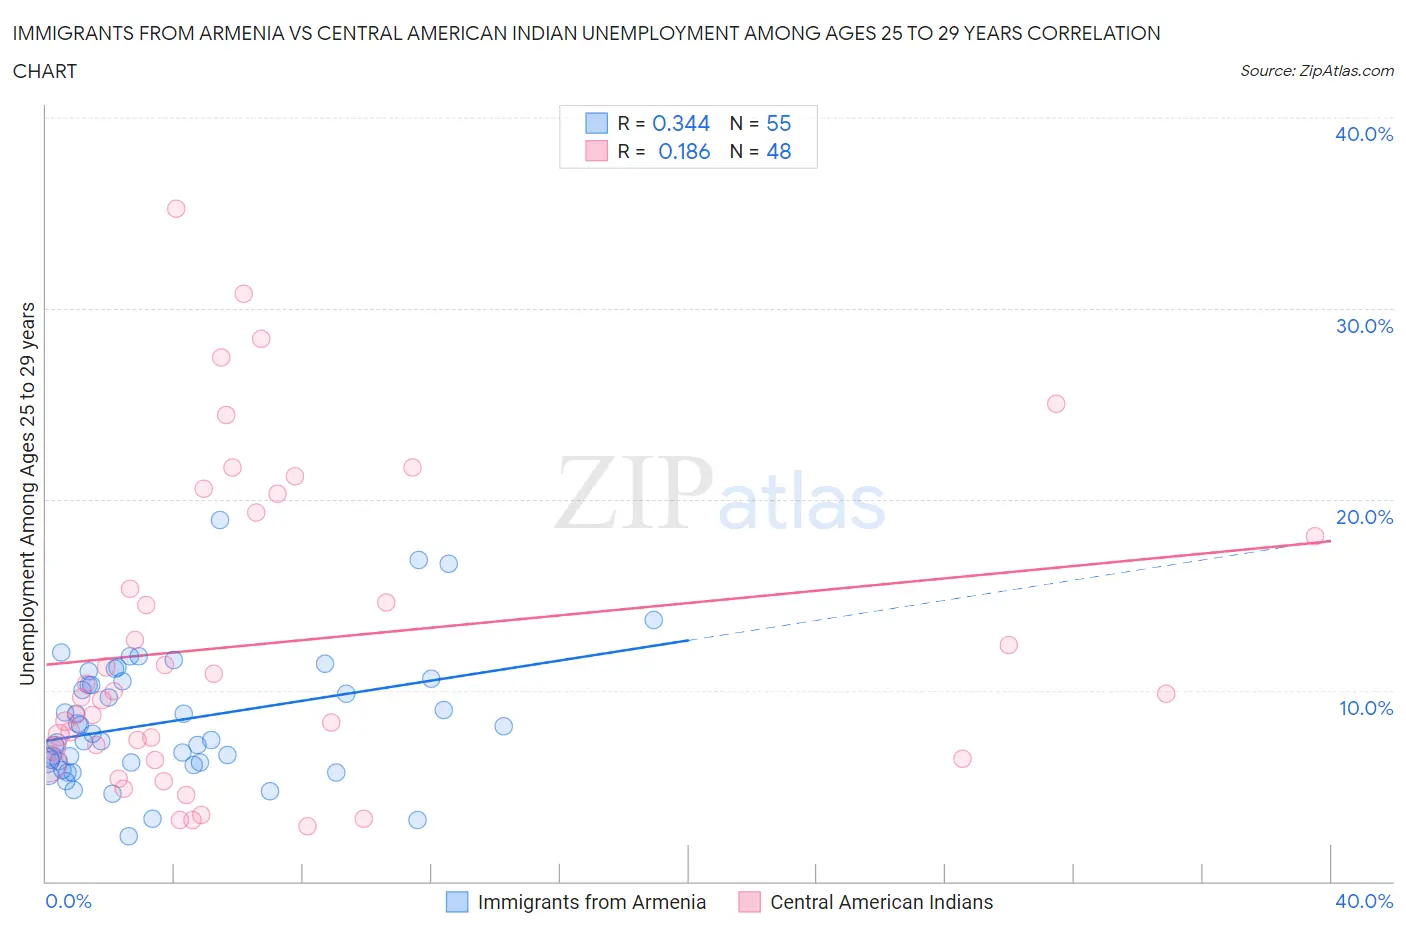
Immigrants from Armenia vs Central American Indian Unemployment Among Ages 25 to 29 years Correlation Chart
The statistical analysis conducted on geographies consisting of 96,699,848 people shows a mild positive correlation between the proportion of Immigrants from Armenia and unemployment rate among population between the ages 25 and 29 in the United States with a correlation coefficient (R) of 0.344 and weighted average of 8.5%. Similarly, the statistical analysis conducted on geographies consisting of 316,380,983 people shows a poor positive correlation between the proportion of Central American Indians and unemployment rate among population between the ages 25 and 29 in the United States with a correlation coefficient (R) of 0.186 and weighted average of 7.9%, a difference of 7.5%.
Unemployment Among Ages 25 to 29 years Correlation Summary
| Measurement | Immigrants from Armenia | Central American Indian |
| Minimum | 2.4% | 2.9% |
| Maximum | 18.9% | 35.2% |
| Range | 16.5% | 32.3% |
| Mean | 8.4% | 12.5% |
| Median | 7.4% | 9.7% |
| Interquartile 25% (IQ1) | 6.2% | 6.7% |
| Interquartile 75% (IQ3) | 10.5% | 18.7% |
| Interquartile Range (IQR) | 4.3% | 12.0% |
| Standard Deviation (Sample) | 3.3% | 8.1% |
| Standard Deviation (Population) | 3.3% | 8.1% |
Demographics Similar to Immigrants from Armenia and Central American Indians by Unemployment Among Ages 25 to 29 years
In terms of unemployment among ages 25 to 29 years, the demographic groups most similar to Immigrants from Armenia are Guyanese (8.5%, a difference of 0.23%), Immigrants from Guyana (8.5%, a difference of 0.48%), Immigrants from Grenada (8.4%, a difference of 0.57%), British West Indian (8.4%, a difference of 0.64%), and Immigrants from Dominica (8.4%, a difference of 1.2%). Similarly, the demographic groups most similar to Central American Indians are Barbadian (7.9%, a difference of 0.020%), West Indian (7.9%, a difference of 0.030%), Jamaican (7.9%, a difference of 0.18%), Immigrants from Yemen (8.0%, a difference of 1.1%), and Cajun (8.0%, a difference of 1.3%).
| Demographics | Rating | Rank | Unemployment Among Ages 25 to 29 years |
| Barbadians | 0.0 /100 | #299 | Tragic 7.9% |
| Central American Indians | 0.0 /100 | #300 | Tragic 7.9% |
| West Indians | 0.0 /100 | #301 | Tragic 7.9% |
| Jamaicans | 0.0 /100 | #302 | Tragic 7.9% |
| Immigrants | Yemen | 0.0 /100 | #303 | Tragic 8.0% |
| Cajuns | 0.0 /100 | #304 | Tragic 8.0% |
| Tsimshian | 0.0 /100 | #305 | Tragic 8.0% |
| Haitians | 0.0 /100 | #306 | Tragic 8.0% |
| Immigrants | Barbados | 0.0 /100 | #307 | Tragic 8.0% |
| Immigrants | Jamaica | 0.0 /100 | #308 | Tragic 8.1% |
| Immigrants | Haiti | 0.0 /100 | #309 | Tragic 8.1% |
| U.S. Virgin Islanders | 0.0 /100 | #310 | Tragic 8.1% |
| Immigrants | Azores | 0.0 /100 | #311 | Tragic 8.1% |
| Dutch West Indians | 0.0 /100 | #312 | Tragic 8.2% |
| Immigrants | St. Vincent and the Grenadines | 0.0 /100 | #313 | Tragic 8.4% |
| Immigrants | Dominica | 0.0 /100 | #314 | Tragic 8.4% |
| British West Indians | 0.0 /100 | #315 | Tragic 8.4% |
| Immigrants | Grenada | 0.0 /100 | #316 | Tragic 8.4% |
| Immigrants | Guyana | 0.0 /100 | #317 | Tragic 8.5% |
| Guyanese | 0.0 /100 | #318 | Tragic 8.5% |
| Immigrants | Armenia | 0.0 /100 | #319 | Tragic 8.5% |