Immigrants from Armenia vs Belizean Unemployment Among Ages 55 to 59 years
COMPARE
Immigrants from Armenia
Belizean
Unemployment Among Ages 55 to 59 years
Unemployment Among Ages 55 to 59 years Comparison
Immigrants from Armenia
Belizeans
6.0%
UNEMPLOYMENT AMONG AGES 55 TO 59 YEARS
0.0/ 100
METRIC RATING
325th/ 347
METRIC RANK
5.6%
UNEMPLOYMENT AMONG AGES 55 TO 59 YEARS
0.0/ 100
METRIC RATING
310th/ 347
METRIC RANK
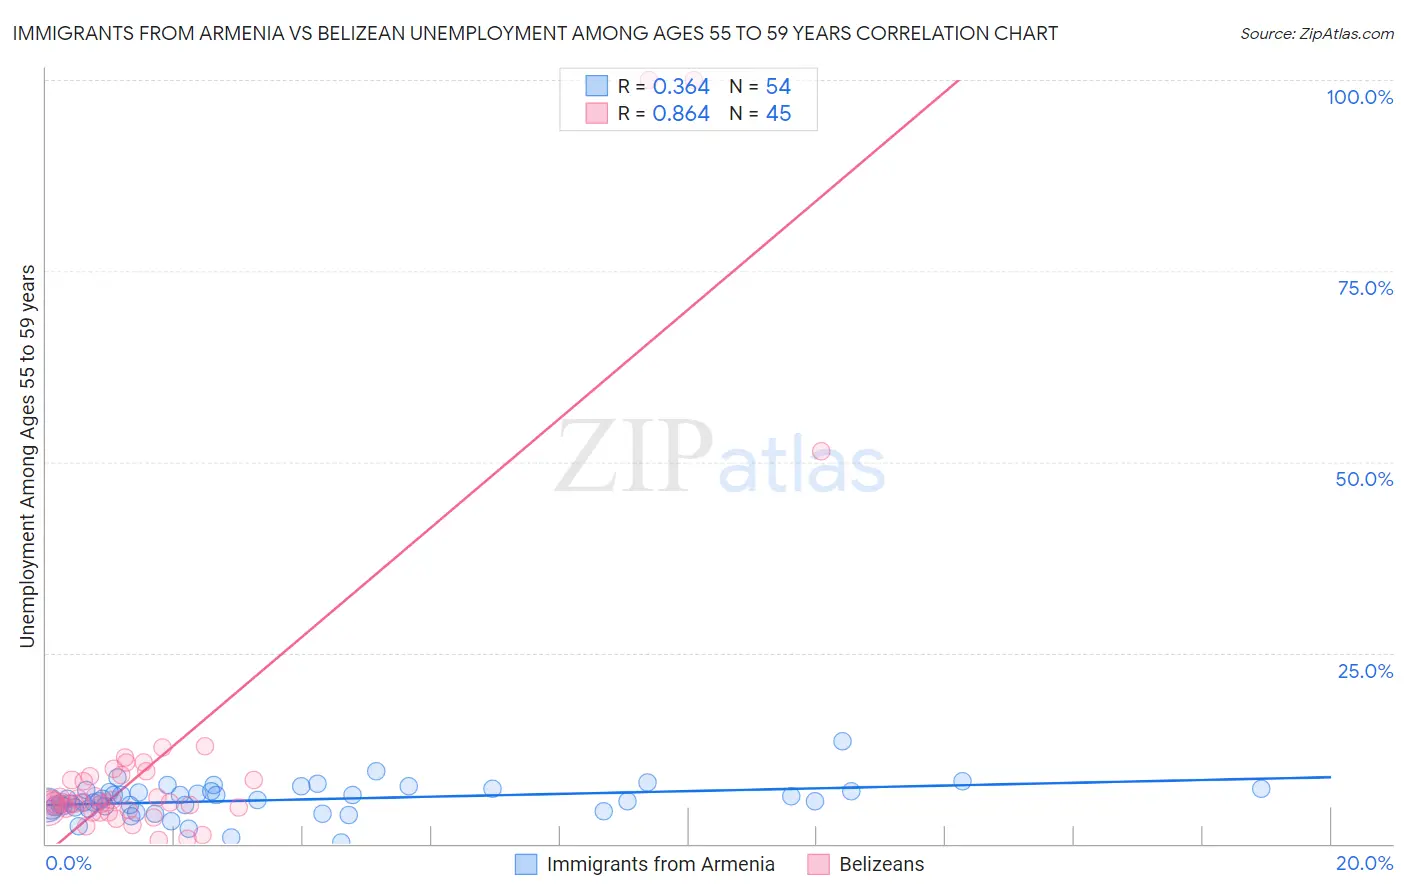
Immigrants from Armenia vs Belizean Unemployment Among Ages 55 to 59 years Correlation Chart
The statistical analysis conducted on geographies consisting of 96,295,490 people shows a mild positive correlation between the proportion of Immigrants from Armenia and unemployment rate among population between the ages 55 and 59 in the United States with a correlation coefficient (R) of 0.364 and weighted average of 6.0%. Similarly, the statistical analysis conducted on geographies consisting of 141,169,321 people shows a very strong positive correlation between the proportion of Belizeans and unemployment rate among population between the ages 55 and 59 in the United States with a correlation coefficient (R) of 0.864 and weighted average of 5.6%, a difference of 6.6%.
Unemployment Among Ages 55 to 59 years Correlation Summary
| Measurement | Immigrants from Armenia | Belizean |
| Minimum | 0.20% | 0.57% |
| Maximum | 13.4% | 100.0% |
| Range | 13.2% | 99.4% |
| Mean | 5.7% | 11.2% |
| Median | 5.7% | 5.5% |
| Interquartile 25% (IQ1) | 4.7% | 4.5% |
| Interquartile 75% (IQ3) | 6.8% | 8.9% |
| Interquartile Range (IQR) | 2.1% | 4.3% |
| Standard Deviation (Sample) | 2.1% | 20.7% |
| Standard Deviation (Population) | 2.1% | 20.5% |
Demographics Similar to Immigrants from Armenia and Belizeans by Unemployment Among Ages 55 to 59 years
In terms of unemployment among ages 55 to 59 years, the demographic groups most similar to Immigrants from Armenia are Native/Alaskan (6.0%, a difference of 0.37%), Arapaho (6.1%, a difference of 1.3%), Vietnamese (5.9%, a difference of 1.8%), Immigrants from Bangladesh (5.9%, a difference of 1.8%), and Crow (5.9%, a difference of 1.8%). Similarly, the demographic groups most similar to Belizeans are Houma (5.6%, a difference of 0.18%), Ecuadorian (5.6%, a difference of 0.39%), Nepalese (5.6%, a difference of 0.44%), Central American Indian (5.6%, a difference of 0.58%), and Tlingit-Haida (5.7%, a difference of 0.87%).
| Demographics | Rating | Rank | Unemployment Among Ages 55 to 59 years |
| Immigrants | Belize | 0.0 /100 | #307 | Tragic 5.5% |
| Spanish American Indians | 0.0 /100 | #308 | Tragic 5.6% |
| Nepalese | 0.0 /100 | #309 | Tragic 5.6% |
| Belizeans | 0.0 /100 | #310 | Tragic 5.6% |
| Houma | 0.0 /100 | #311 | Tragic 5.6% |
| Ecuadorians | 0.0 /100 | #312 | Tragic 5.6% |
| Central American Indians | 0.0 /100 | #313 | Tragic 5.6% |
| Tlingit-Haida | 0.0 /100 | #314 | Tragic 5.7% |
| Guyanese | 0.0 /100 | #315 | Tragic 5.7% |
| Immigrants | Ecuador | 0.0 /100 | #316 | Tragic 5.7% |
| Hmong | 0.0 /100 | #317 | Tragic 5.7% |
| Immigrants | Guyana | 0.0 /100 | #318 | Tragic 5.8% |
| Kiowa | 0.0 /100 | #319 | Tragic 5.8% |
| Immigrants | Azores | 0.0 /100 | #320 | Tragic 5.8% |
| Chippewa | 0.0 /100 | #321 | Tragic 5.9% |
| Crow | 0.0 /100 | #322 | Tragic 5.9% |
| Immigrants | Bangladesh | 0.0 /100 | #323 | Tragic 5.9% |
| Vietnamese | 0.0 /100 | #324 | Tragic 5.9% |
| Immigrants | Armenia | 0.0 /100 | #325 | Tragic 6.0% |
| Natives/Alaskans | 0.0 /100 | #326 | Tragic 6.0% |
| Arapaho | 0.0 /100 | #327 | Tragic 6.1% |