Immigrants from Argentina vs Hungarian Unemployment Among Ages 65 to 74 years
COMPARE
Immigrants from Argentina
Hungarian
Unemployment Among Ages 65 to 74 years
Unemployment Among Ages 65 to 74 years Comparison
Immigrants from Argentina
Hungarians
5.6%
UNEMPLOYMENT AMONG AGES 65 TO 74 YEARS
0.9/ 100
METRIC RATING
248th/ 347
METRIC RANK
5.5%
UNEMPLOYMENT AMONG AGES 65 TO 74 YEARS
4.4/ 100
METRIC RATING
223rd/ 347
METRIC RANK
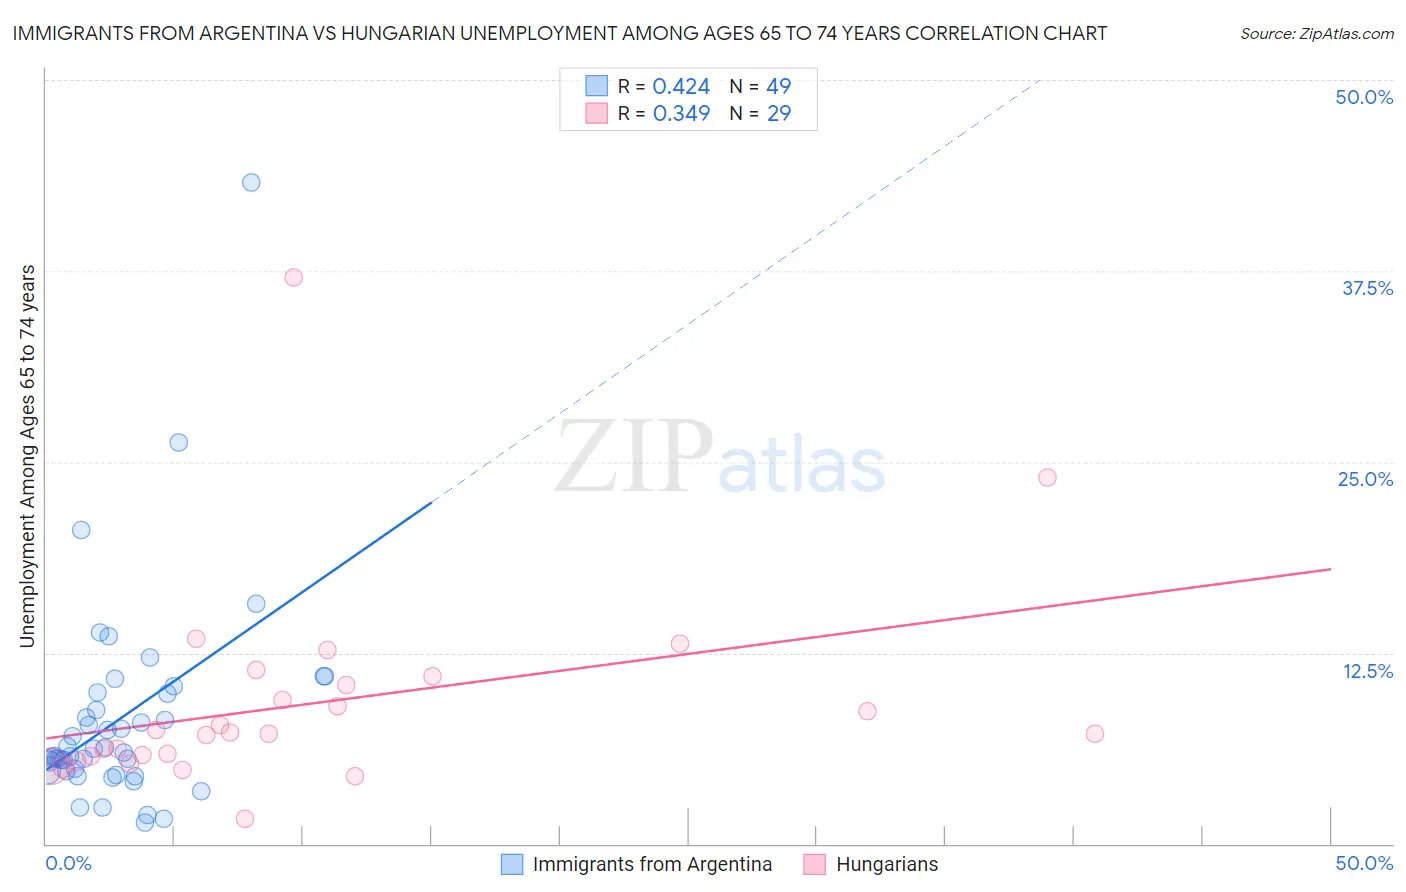
Immigrants from Argentina vs Hungarian Unemployment Among Ages 65 to 74 years Correlation Chart
The statistical analysis conducted on geographies consisting of 245,483,192 people shows a moderate positive correlation between the proportion of Immigrants from Argentina and unemployment rate among population between the ages 65 and 74 in the United States with a correlation coefficient (R) of 0.424 and weighted average of 5.6%. Similarly, the statistical analysis conducted on geographies consisting of 405,744,527 people shows a mild positive correlation between the proportion of Hungarians and unemployment rate among population between the ages 65 and 74 in the United States with a correlation coefficient (R) of 0.349 and weighted average of 5.5%, a difference of 1.4%.
Unemployment Among Ages 65 to 74 years Correlation Summary
| Measurement | Immigrants from Argentina | Hungarian |
| Minimum | 1.4% | 1.7% |
| Maximum | 43.3% | 37.0% |
| Range | 41.9% | 35.4% |
| Mean | 8.2% | 9.2% |
| Median | 6.0% | 7.2% |
| Interquartile 25% (IQ1) | 4.8% | 5.6% |
| Interquartile 75% (IQ3) | 9.8% | 10.7% |
| Interquartile Range (IQR) | 5.1% | 5.1% |
| Standard Deviation (Sample) | 6.9% | 6.8% |
| Standard Deviation (Population) | 6.8% | 6.7% |
Similar Demographics by Unemployment Among Ages 65 to 74 years
Demographics Similar to Immigrants from Argentina by Unemployment Among Ages 65 to 74 years
In terms of unemployment among ages 65 to 74 years, the demographic groups most similar to Immigrants from Argentina are Immigrants (5.6%, a difference of 0.0%), Paraguayan (5.6%, a difference of 0.050%), Immigrants from Micronesia (5.6%, a difference of 0.060%), Immigrants from Greece (5.6%, a difference of 0.060%), and Trinidadian and Tobagonian (5.6%, a difference of 0.060%).
| Demographics | Rating | Rank | Unemployment Among Ages 65 to 74 years |
| Cree | 1.4 /100 | #241 | Tragic 5.6% |
| Immigrants | Ghana | 1.4 /100 | #242 | Tragic 5.6% |
| Immigrants | Peru | 1.3 /100 | #243 | Tragic 5.6% |
| Immigrants | Micronesia | 0.9 /100 | #244 | Tragic 5.6% |
| Immigrants | Greece | 0.9 /100 | #245 | Tragic 5.6% |
| Paraguayans | 0.9 /100 | #246 | Tragic 5.6% |
| Immigrants | Immigrants | 0.9 /100 | #247 | Tragic 5.6% |
| Immigrants | Argentina | 0.9 /100 | #248 | Tragic 5.6% |
| Trinidadians and Tobagonians | 0.8 /100 | #249 | Tragic 5.6% |
| Cape Verdeans | 0.7 /100 | #250 | Tragic 5.6% |
| Brazilians | 0.5 /100 | #251 | Tragic 5.6% |
| Colombians | 0.5 /100 | #252 | Tragic 5.6% |
| Immigrants | Brazil | 0.5 /100 | #253 | Tragic 5.6% |
| Immigrants | Costa Rica | 0.5 /100 | #254 | Tragic 5.6% |
| Immigrants | Haiti | 0.4 /100 | #255 | Tragic 5.6% |
Demographics Similar to Hungarians by Unemployment Among Ages 65 to 74 years
In terms of unemployment among ages 65 to 74 years, the demographic groups most similar to Hungarians are Apache (5.5%, a difference of 0.010%), Immigrants from Uruguay (5.5%, a difference of 0.050%), Spaniard (5.5%, a difference of 0.060%), Immigrants from Trinidad and Tobago (5.5%, a difference of 0.060%), and Immigrants from Syria (5.5%, a difference of 0.11%).
| Demographics | Rating | Rank | Unemployment Among Ages 65 to 74 years |
| Uruguayans | 6.2 /100 | #216 | Tragic 5.5% |
| Blackfeet | 5.8 /100 | #217 | Tragic 5.5% |
| Samoans | 5.7 /100 | #218 | Tragic 5.5% |
| Alsatians | 5.6 /100 | #219 | Tragic 5.5% |
| Immigrants | Syria | 5.1 /100 | #220 | Tragic 5.5% |
| Spaniards | 4.8 /100 | #221 | Tragic 5.5% |
| Apache | 4.5 /100 | #222 | Tragic 5.5% |
| Hungarians | 4.4 /100 | #223 | Tragic 5.5% |
| Immigrants | Uruguay | 4.2 /100 | #224 | Tragic 5.5% |
| Immigrants | Trinidad and Tobago | 4.1 /100 | #225 | Tragic 5.5% |
| Hondurans | 3.7 /100 | #226 | Tragic 5.5% |
| Immigrants | Albania | 3.7 /100 | #227 | Tragic 5.5% |
| Immigrants | Israel | 3.0 /100 | #228 | Tragic 5.5% |
| West Indians | 2.7 /100 | #229 | Tragic 5.5% |
| Immigrants | Caribbean | 2.7 /100 | #230 | Tragic 5.5% |