Immigrants from Albania vs French Unemployment Among Women with Children Under 18 years
COMPARE
Immigrants from Albania
French
Unemployment Among Women with Children Under 18 years
Unemployment Among Women with Children Under 18 years Comparison
Immigrants from Albania
French
5.2%
UNEMPLOYMENT AMONG WOMEN WITH CHILDREN UNDER 18 YEARS
92.2/ 100
METRIC RATING
96th/ 347
METRIC RANK
5.2%
UNEMPLOYMENT AMONG WOMEN WITH CHILDREN UNDER 18 YEARS
88.4/ 100
METRIC RATING
113th/ 347
METRIC RANK
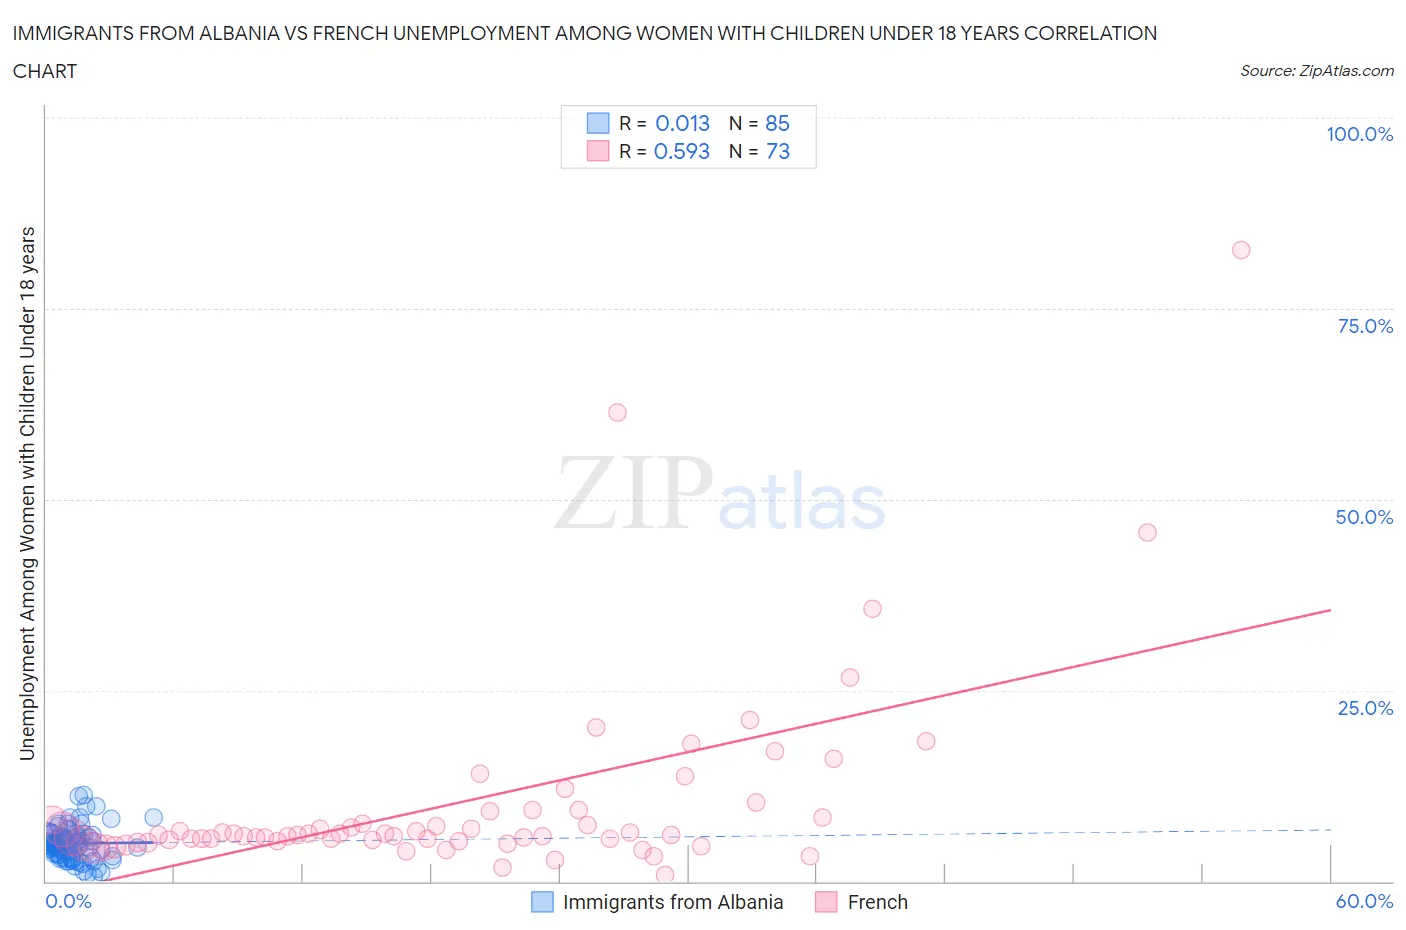
Immigrants from Albania vs French Unemployment Among Women with Children Under 18 years Correlation Chart
The statistical analysis conducted on geographies consisting of 117,672,855 people shows no correlation between the proportion of Immigrants from Albania and unemployment rate among women with children under the age of 18 in the United States with a correlation coefficient (R) of 0.013 and weighted average of 5.2%. Similarly, the statistical analysis conducted on geographies consisting of 516,708,642 people shows a substantial positive correlation between the proportion of French and unemployment rate among women with children under the age of 18 in the United States with a correlation coefficient (R) of 0.593 and weighted average of 5.2%, a difference of 0.81%.
Unemployment Among Women with Children Under 18 years Correlation Summary
| Measurement | Immigrants from Albania | French |
| Minimum | 0.70% | 0.90% |
| Maximum | 11.3% | 82.7% |
| Range | 10.6% | 81.8% |
| Mean | 5.0% | 10.2% |
| Median | 4.9% | 6.0% |
| Interquartile 25% (IQ1) | 3.4% | 5.2% |
| Interquartile 75% (IQ3) | 6.0% | 8.8% |
| Interquartile Range (IQR) | 2.7% | 3.5% |
| Standard Deviation (Sample) | 2.1% | 12.8% |
| Standard Deviation (Population) | 2.1% | 12.7% |
Demographics Similar to Immigrants from Albania and French by Unemployment Among Women with Children Under 18 years
In terms of unemployment among women with children under 18 years, the demographic groups most similar to Immigrants from Albania are Palestinian (5.2%, a difference of 0.0%), Immigrants from North America (5.2%, a difference of 0.020%), Immigrants from Vietnam (5.2%, a difference of 0.040%), Cuban (5.2%, a difference of 0.10%), and Immigrants from Kuwait (5.2%, a difference of 0.11%). Similarly, the demographic groups most similar to French are Immigrants from Eastern Europe (5.2%, a difference of 0.010%), Kenyan (5.3%, a difference of 0.040%), Immigrants from Czechoslovakia (5.2%, a difference of 0.090%), French Canadian (5.2%, a difference of 0.090%), and Immigrants from Russia (5.2%, a difference of 0.11%).
| Demographics | Rating | Rank | Unemployment Among Women with Children Under 18 years |
| Immigrants | Kuwait | 92.6 /100 | #94 | Exceptional 5.2% |
| Immigrants | North America | 92.3 /100 | #95 | Exceptional 5.2% |
| Immigrants | Albania | 92.2 /100 | #96 | Exceptional 5.2% |
| Palestinians | 92.2 /100 | #97 | Exceptional 5.2% |
| Immigrants | Vietnam | 92.0 /100 | #98 | Exceptional 5.2% |
| Cubans | 91.8 /100 | #99 | Exceptional 5.2% |
| Immigrants | Greece | 91.4 /100 | #100 | Exceptional 5.2% |
| Immigrants | Netherlands | 91.0 /100 | #101 | Exceptional 5.2% |
| Immigrants | Cuba | 90.9 /100 | #102 | Exceptional 5.2% |
| Sri Lankans | 90.3 /100 | #103 | Exceptional 5.2% |
| Immigrants | Switzerland | 90.1 /100 | #104 | Exceptional 5.2% |
| Immigrants | France | 90.0 /100 | #105 | Excellent 5.2% |
| Pakistanis | 89.9 /100 | #106 | Excellent 5.2% |
| Slavs | 89.8 /100 | #107 | Excellent 5.2% |
| Iranians | 89.7 /100 | #108 | Excellent 5.2% |
| Immigrants | Russia | 89.0 /100 | #109 | Excellent 5.2% |
| Immigrants | Czechoslovakia | 88.9 /100 | #110 | Excellent 5.2% |
| French Canadians | 88.9 /100 | #111 | Excellent 5.2% |
| Immigrants | Eastern Europe | 88.5 /100 | #112 | Excellent 5.2% |
| French | 88.4 /100 | #113 | Excellent 5.2% |
| Kenyans | 88.2 /100 | #114 | Excellent 5.3% |