Immigrants from Albania vs Central American Indian Unemployment Among Youth under 25 years
COMPARE
Immigrants from Albania
Central American Indian
Unemployment Among Youth under 25 years
Unemployment Among Youth under 25 years Comparison
Immigrants from Albania
Central American Indians
12.1%
UNEMPLOYMENT AMONG YOUTH UNDER 25 YEARS
1.1/ 100
METRIC RATING
241st/ 347
METRIC RANK
13.5%
UNEMPLOYMENT AMONG YOUTH UNDER 25 YEARS
0.0/ 100
METRIC RATING
292nd/ 347
METRIC RANK
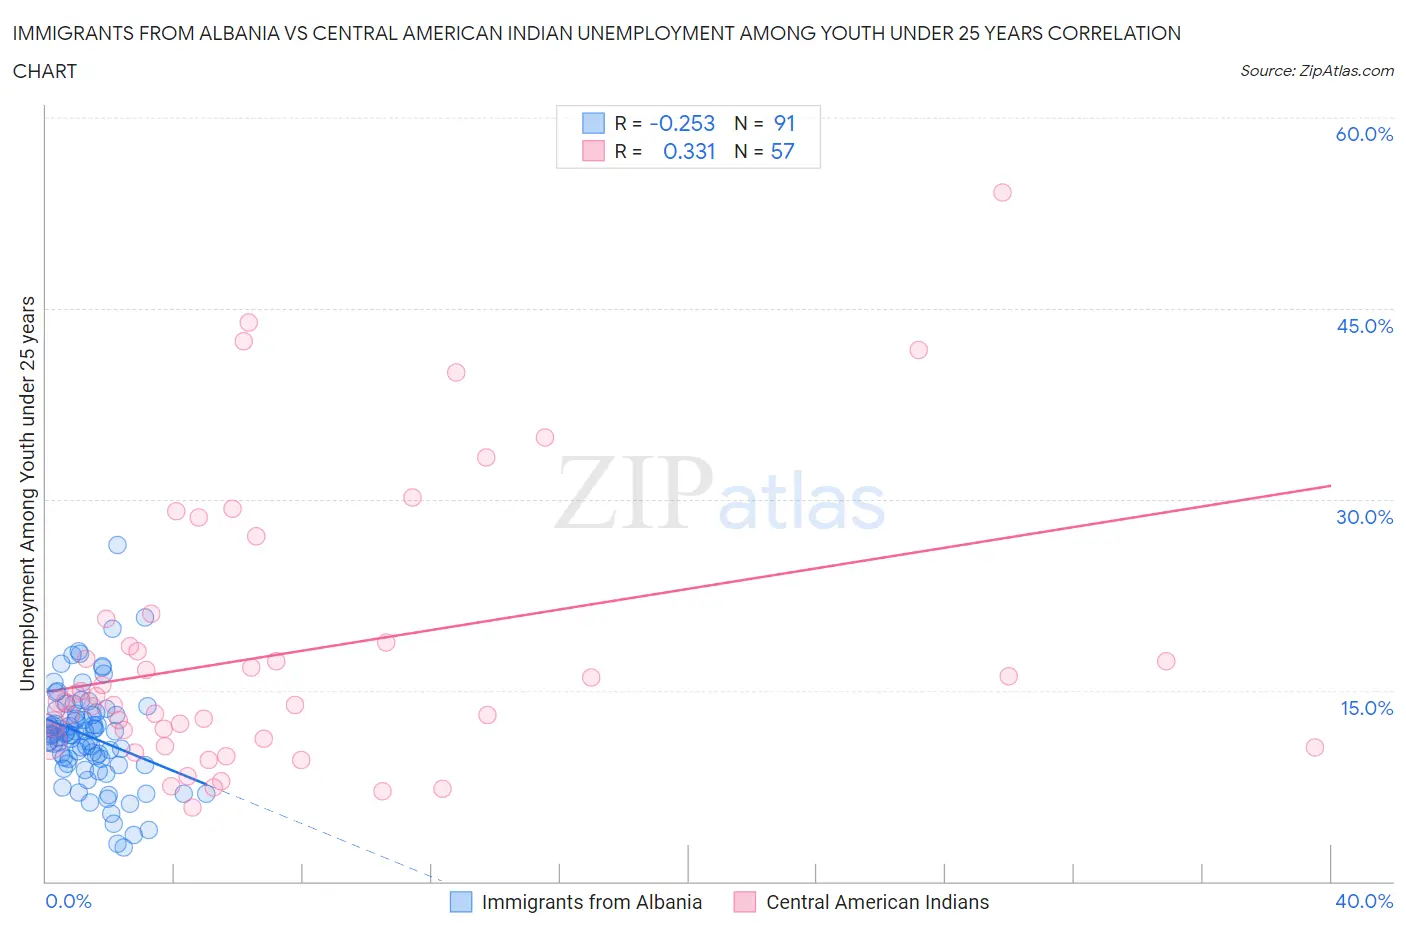
Immigrants from Albania vs Central American Indian Unemployment Among Youth under 25 years Correlation Chart
The statistical analysis conducted on geographies consisting of 118,834,008 people shows a weak negative correlation between the proportion of Immigrants from Albania and unemployment rate among youth under the age of 25 in the United States with a correlation coefficient (R) of -0.253 and weighted average of 12.1%. Similarly, the statistical analysis conducted on geographies consisting of 324,054,226 people shows a mild positive correlation between the proportion of Central American Indians and unemployment rate among youth under the age of 25 in the United States with a correlation coefficient (R) of 0.331 and weighted average of 13.5%, a difference of 10.9%.
Unemployment Among Youth under 25 years Correlation Summary
| Measurement | Immigrants from Albania | Central American Indian |
| Minimum | 2.7% | 5.8% |
| Maximum | 26.4% | 54.1% |
| Range | 23.7% | 48.3% |
| Mean | 11.4% | 18.0% |
| Median | 11.5% | 14.1% |
| Interquartile 25% (IQ1) | 9.3% | 11.1% |
| Interquartile 75% (IQ3) | 13.2% | 19.7% |
| Interquartile Range (IQR) | 3.9% | 8.6% |
| Standard Deviation (Sample) | 3.9% | 10.7% |
| Standard Deviation (Population) | 3.9% | 10.6% |
Similar Demographics by Unemployment Among Youth under 25 years
Demographics Similar to Immigrants from Albania by Unemployment Among Youth under 25 years
In terms of unemployment among youth under 25 years, the demographic groups most similar to Immigrants from Albania are Dutch West Indian (12.1%, a difference of 0.020%), Immigrants from Africa (12.1%, a difference of 0.050%), Albanian (12.1%, a difference of 0.10%), Native Hawaiian (12.1%, a difference of 0.17%), and Immigrants (12.1%, a difference of 0.19%).
| Demographics | Rating | Rank | Unemployment Among Youth under 25 years |
| Guatemalans | 1.4 /100 | #234 | Tragic 12.1% |
| Immigrants | Guatemala | 1.4 /100 | #235 | Tragic 12.1% |
| Immigrants | Immigrants | 1.3 /100 | #236 | Tragic 12.1% |
| Native Hawaiians | 1.3 /100 | #237 | Tragic 12.1% |
| Albanians | 1.2 /100 | #238 | Tragic 12.1% |
| Immigrants | Africa | 1.1 /100 | #239 | Tragic 12.1% |
| Dutch West Indians | 1.1 /100 | #240 | Tragic 12.1% |
| Immigrants | Albania | 1.1 /100 | #241 | Tragic 12.1% |
| Immigrants | Western Asia | 0.8 /100 | #242 | Tragic 12.2% |
| Immigrants | Azores | 0.6 /100 | #243 | Tragic 12.2% |
| Alaskan Athabascans | 0.6 /100 | #244 | Tragic 12.2% |
| Spanish Americans | 0.6 /100 | #245 | Tragic 12.2% |
| Immigrants | Honduras | 0.6 /100 | #246 | Tragic 12.2% |
| Immigrants | Greece | 0.6 /100 | #247 | Tragic 12.2% |
| Central Americans | 0.6 /100 | #248 | Tragic 12.2% |
Demographics Similar to Central American Indians by Unemployment Among Youth under 25 years
In terms of unemployment among youth under 25 years, the demographic groups most similar to Central American Indians are Apache (13.5%, a difference of 0.030%), Spanish American Indian (13.5%, a difference of 0.11%), Immigrants from Caribbean (13.5%, a difference of 0.27%), Immigrants from Ecuador (13.4%, a difference of 0.28%), and Chippewa (13.5%, a difference of 0.51%).
| Demographics | Rating | Rank | Unemployment Among Youth under 25 years |
| Ghanaians | 0.0 /100 | #285 | Tragic 13.3% |
| Blackfeet | 0.0 /100 | #286 | Tragic 13.3% |
| Ecuadorians | 0.0 /100 | #287 | Tragic 13.3% |
| Immigrants | Western Africa | 0.0 /100 | #288 | Tragic 13.4% |
| Immigrants | Ghana | 0.0 /100 | #289 | Tragic 13.4% |
| Immigrants | Ecuador | 0.0 /100 | #290 | Tragic 13.4% |
| Apache | 0.0 /100 | #291 | Tragic 13.5% |
| Central American Indians | 0.0 /100 | #292 | Tragic 13.5% |
| Spanish American Indians | 0.0 /100 | #293 | Tragic 13.5% |
| Immigrants | Caribbean | 0.0 /100 | #294 | Tragic 13.5% |
| Chippewa | 0.0 /100 | #295 | Tragic 13.5% |
| Senegalese | 0.0 /100 | #296 | Tragic 13.5% |
| U.S. Virgin Islanders | 0.0 /100 | #297 | Tragic 13.6% |
| Shoshone | 0.0 /100 | #298 | Tragic 13.7% |
| Tohono O'odham | 0.0 /100 | #299 | Tragic 13.8% |