Immigrants from Africa vs Immigrants from Afghanistan Unemployment Among Ages 30 to 34 years
COMPARE
Immigrants from Africa
Immigrants from Afghanistan
Unemployment Among Ages 30 to 34 years
Unemployment Among Ages 30 to 34 years Comparison
Immigrants from Africa
Immigrants from Afghanistan
5.5%
UNEMPLOYMENT AMONG AGES 30 TO 34 YEARS
31.0/ 100
METRIC RATING
193rd/ 347
METRIC RANK
5.6%
UNEMPLOYMENT AMONG AGES 30 TO 34 YEARS
27.2/ 100
METRIC RATING
198th/ 347
METRIC RANK
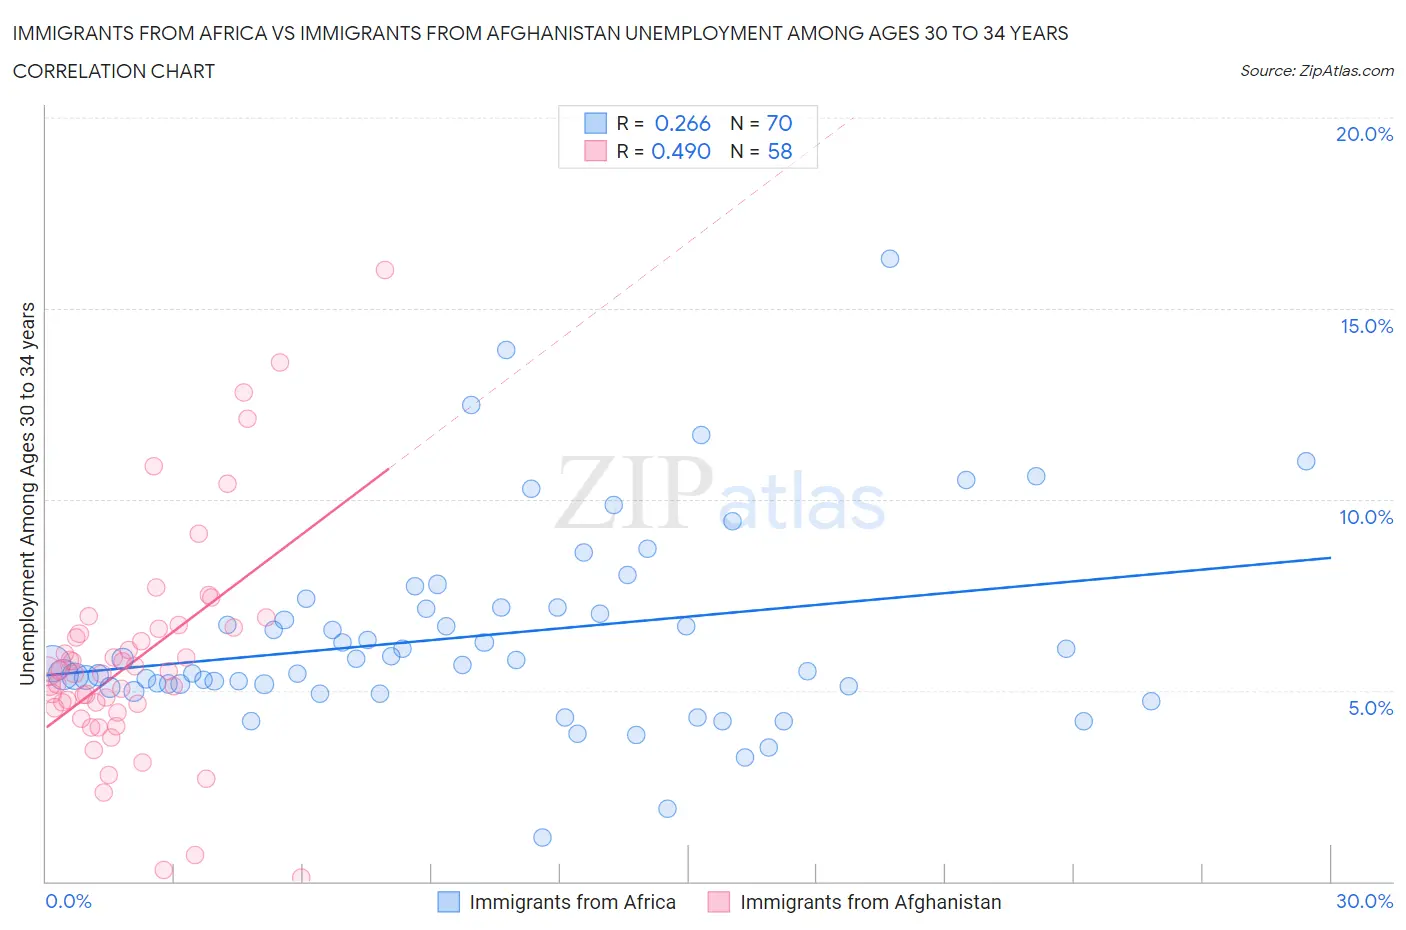
Immigrants from Africa vs Immigrants from Afghanistan Unemployment Among Ages 30 to 34 years Correlation Chart
The statistical analysis conducted on geographies consisting of 436,875,352 people shows a weak positive correlation between the proportion of Immigrants from Africa and unemployment rate among population between the ages 30 and 34 in the United States with a correlation coefficient (R) of 0.266 and weighted average of 5.5%. Similarly, the statistical analysis conducted on geographies consisting of 145,285,399 people shows a moderate positive correlation between the proportion of Immigrants from Afghanistan and unemployment rate among population between the ages 30 and 34 in the United States with a correlation coefficient (R) of 0.490 and weighted average of 5.6%, a difference of 0.32%.
Unemployment Among Ages 30 to 34 years Correlation Summary
| Measurement | Immigrants from Africa | Immigrants from Afghanistan |
| Minimum | 1.2% | 0.10% |
| Maximum | 16.3% | 16.0% |
| Range | 15.1% | 15.9% |
| Mean | 6.4% | 5.8% |
| Median | 5.7% | 5.5% |
| Interquartile 25% (IQ1) | 5.1% | 4.5% |
| Interquartile 75% (IQ3) | 7.2% | 6.6% |
| Interquartile Range (IQR) | 2.1% | 2.1% |
| Standard Deviation (Sample) | 2.6% | 2.9% |
| Standard Deviation (Population) | 2.6% | 2.9% |
Demographics Similar to Immigrants from Africa and Immigrants from Afghanistan by Unemployment Among Ages 30 to 34 years
In terms of unemployment among ages 30 to 34 years, the demographic groups most similar to Immigrants from Africa are Irish (5.5%, a difference of 0.020%), Moroccan (5.5%, a difference of 0.020%), Slavic (5.5%, a difference of 0.020%), Finnish (5.5%, a difference of 0.030%), and Immigrants from South America (5.5%, a difference of 0.10%). Similarly, the demographic groups most similar to Immigrants from Afghanistan are Nicaraguan (5.6%, a difference of 0.050%), Immigrants from Southern Europe (5.6%, a difference of 0.13%), Immigrants from Nicaragua (5.5%, a difference of 0.14%), Immigrants from South America (5.5%, a difference of 0.22%), and South American Indian (5.6%, a difference of 0.25%).
| Demographics | Rating | Rank | Unemployment Among Ages 30 to 34 years |
| Immigrants | Western Europe | 39.1 /100 | #185 | Fair 5.5% |
| Canadians | 38.2 /100 | #186 | Fair 5.5% |
| Immigrants | Western Asia | 38.2 /100 | #187 | Fair 5.5% |
| Immigrants | Norway | 36.1 /100 | #188 | Fair 5.5% |
| Immigrants | England | 35.7 /100 | #189 | Fair 5.5% |
| Immigrants | Kazakhstan | 33.9 /100 | #190 | Fair 5.5% |
| Irish | 31.3 /100 | #191 | Fair 5.5% |
| Moroccans | 31.2 /100 | #192 | Fair 5.5% |
| Immigrants | Africa | 31.0 /100 | #193 | Fair 5.5% |
| Slavs | 30.9 /100 | #194 | Fair 5.5% |
| Finns | 30.7 /100 | #195 | Fair 5.5% |
| Immigrants | South America | 29.8 /100 | #196 | Fair 5.5% |
| Immigrants | Nicaragua | 28.9 /100 | #197 | Fair 5.5% |
| Immigrants | Afghanistan | 27.2 /100 | #198 | Fair 5.6% |
| Nicaraguans | 26.6 /100 | #199 | Fair 5.6% |
| Immigrants | Southern Europe | 25.8 /100 | #200 | Fair 5.6% |
| South American Indians | 24.4 /100 | #201 | Fair 5.6% |
| Immigrants | Germany | 22.9 /100 | #202 | Fair 5.6% |
| Koreans | 20.7 /100 | #203 | Fair 5.6% |
| Immigrants | Cameroon | 18.4 /100 | #204 | Poor 5.6% |
| Immigrants | Costa Rica | 14.4 /100 | #205 | Poor 5.6% |