Immigrants from Africa vs African Unemployment Among Women with Children Ages 6 to 17 years

COMPARE

Immigrants from Africa
Race
Ancestry
AfghanAlaska NativeAlaskan AthabascanAlbanianAleutAlsatianAmericanApacheArabArapahoArgentineanArmenianAssyrian/Chaldean/SyriacAustralianAustrianBahamianBangladeshiBarbadianBasqueBelgianBelizeanBermudanBhutaneseBlackfeetBolivianBrazilianBritishBritish West IndianBulgarianBurmeseCajunCambodianCanadianCape VerdeanCarpatho RusynCelticCentral AmericanCentral American IndianCherokeeCheyenneChickasawChileanChineseChippewaChoctawColombianColvilleComancheCosta RicanCreeCreekCroatianCrowCubanCypriotCzechCzechoslovakianDanishDelawareDominicanDutchDutch West IndianEastern EuropeanEcuadorianEgyptianEnglishEstonianEthiopianEuropeanFijianFilipinoFinnishFrenchFrench American IndianFrench CanadianGermanGerman RussianGhanaianGreekGuamanian/ChamorroGuatemalanGuyaneseHaitianHmongHonduranHopiHoumaHungarianIcelanderIndian (Asian)IndonesianInupiatIranianIraqiIrishIroquoisIsraeliItalianJamaicanJapaneseJordanianKenyanKiowaKoreanLaotianLatvianLebaneseLiberianLithuanianLumbeeLuxembourgerMacedonianMalaysianMalteseMarshalleseMenomineeMexicanMexican American IndianMongolianMoroccanNative HawaiianNavajoNepaleseNew ZealanderNicaraguanNigerianNorthern EuropeanNorwegianOkinawanOsageOttawaPaiutePakistaniPalestinianPanamanianParaguayanPennsylvania GermanPeruvianPimaPolishPortuguesePotawatomiPuebloPuerto RicanPuget Sound SalishRomanianRussianSalvadoranSamoanScandinavianScotch-IrishScottishSeminoleSenegaleseSerbianShoshoneSierra LeoneanSiouxSlavicSlovakSloveneSomaliSouth AfricanSouth AmericanSouth American IndianSoviet UnionSpaniardSpanishSpanish AmericanSpanish American IndianSri LankanSubsaharan AfricanSudaneseSwedishSwissSyrianTaiwaneseThaiTlingit-HaidaTohono O'OdhamTonganTrinidadian and TobagonianTsimshianTurkishU.S. Virgin IslanderUgandanUkrainianUruguayanUteVenezuelanVietnameseWelshWest IndianYakamaYaquiYugoslavianYumanYup'ikZimbabwean
Immigration
NonimmigrantsImmigrantsAfghanistanAfricaAlbaniaArgentinaArmeniaAsiaAustraliaAustriaBahamasBangladeshBarbadosBelarusBelgiumBelizeBoliviaBosnia and HerzegovinaBrazilBulgariaBurma/MyanmarCabo VerdeCambodiaCameroonCanadaCaribbeanCentral AmericaChileChinaColombiaCongoCosta RicaCroatiaCubaCzechoslovakiaDenmarkDominicaDominican RepublicEastern AfricaEastern AsiaEastern EuropeEcuadorEgyptEl SalvadorEnglandEritreaEthiopiaEuropeFijiFranceGermanyGhanaGreeceGrenadaGuatemalaGuyanaHaitiHondurasHong KongHungaryIndiaIndonesiaIranIraqIrelandIsraelItalyJamaicaJapanJordanKazakhstanKenyaKoreaKuwaitLaosLatin AmericaLatviaLebanonLiberiaLithuaniaMalaysiaMexicoMicronesiaMiddle AfricaMoldovaMoroccoNepalNetherlandsNicaraguaNigeriaNorth AmericaNorth MacedoniaNorthern AfricaNorthern EuropeNorwayOceaniaPakistanPanamaPeruPhilippinesPolandPortugalRomaniaRussiaSaudi ArabiaScotlandSenegalSerbiaSierra LeoneSingaporeSomaliaSouth AfricaSouth AmericaSouth Central AsiaSouth Eastern AsiaSouthern EuropeSpainSri LankaSt. Vincent and the GrenadinesSudanSwedenSwitzerlandSyriaTaiwanThailandTrinidad and TobagoTurkeyUgandaUkraineUruguayUzbekistanVenezuelaVietnamWest IndiesWestern AfricaWestern AsiaWestern EuropeYemenZaireZimbabweAzores
African
Race
Ancestry
AfghanAfricanAlaska NativeAlaskan AthabascanAlbanianAleutAlsatianAmericanApacheArabArapahoArgentineanArmenianAssyrian/Chaldean/SyriacAustralianAustrianBahamianBangladeshiBarbadianBasqueBelgianBelizeanBermudanBhutaneseBlackfeetBolivianBrazilianBritishBritish West IndianBulgarianBurmeseCajunCambodianCanadianCape VerdeanCarpatho RusynCelticCentral AmericanCentral American IndianCherokeeCheyenneChickasawChileanChineseChippewaChoctawColombianColvilleComancheCosta RicanCreeCreekCroatianCrowCubanCypriotCzechCzechoslovakianDanishDelawareDominicanDutchDutch West IndianEastern EuropeanEcuadorianEgyptianEnglishEstonianEthiopianEuropeanFijianFilipinoFinnishFrenchFrench American IndianFrench CanadianGermanGerman RussianGhanaianGreekGuamanian/ChamorroGuatemalanGuyaneseHaitianHmongHonduranHopiHoumaHungarianIcelanderIndian (Asian)IndonesianInupiatIranianIraqiIrishIroquoisIsraeliItalianJamaicanJapaneseJordanianKenyanKiowaKoreanLaotianLatvianLebaneseLiberianLithuanianLumbeeLuxembourgerMacedonianMalaysianMalteseMarshalleseMenomineeMexicanMexican American IndianMongolianMoroccanNative HawaiianNavajoNepaleseNew ZealanderNicaraguanNigerianNorthern EuropeanNorwegianOkinawanOsageOttawaPaiutePakistaniPalestinianPanamanianParaguayanPennsylvania GermanPeruvianPimaPolishPortuguesePotawatomiPuebloPuerto RicanPuget Sound SalishRomanianRussianSalvadoranSamoanScandinavianScotch-IrishScottishSeminoleSenegaleseSerbianShoshoneSierra LeoneanSiouxSlavicSlovakSloveneSomaliSouth AfricanSouth AmericanSouth American IndianSoviet UnionSpaniardSpanishSpanish AmericanSpanish American IndianSri LankanSubsaharan AfricanSudaneseSwedishSwissSyrianTaiwaneseThaiTlingit-HaidaTohono O'OdhamTonganTrinidadian and TobagonianTsimshianTurkishU.S. Virgin IslanderUgandanUkrainianUruguayanUteVenezuelanVietnameseWelshWest IndianYakamaYaquiYugoslavianYumanYup'ikZimbabwean
Immigration
NonimmigrantsImmigrantsAfghanistanAlbaniaArgentinaArmeniaAsiaAustraliaAustriaBahamasBangladeshBarbadosBelarusBelgiumBelizeBoliviaBosnia and HerzegovinaBrazilBulgariaBurma/MyanmarCabo VerdeCambodiaCameroonCanadaCaribbeanCentral AmericaChileChinaColombiaCongoCosta RicaCroatiaCubaCzechoslovakiaDenmarkDominicaDominican RepublicEastern AfricaEastern AsiaEastern EuropeEcuadorEgyptEl SalvadorEnglandEritreaEthiopiaEuropeFijiFranceGermanyGhanaGreeceGrenadaGuatemalaGuyanaHaitiHondurasHong KongHungaryIndiaIndonesiaIranIraqIrelandIsraelItalyJamaicaJapanJordanKazakhstanKenyaKoreaKuwaitLaosLatin AmericaLatviaLebanonLiberiaLithuaniaMalaysiaMexicoMicronesiaMiddle AfricaMoldovaMoroccoNepalNetherlandsNicaraguaNigeriaNorth AmericaNorth MacedoniaNorthern AfricaNorthern EuropeNorwayOceaniaPakistanPanamaPeruPhilippinesPolandPortugalRomaniaRussiaSaudi ArabiaScotlandSenegalSerbiaSierra LeoneSingaporeSomaliaSouth AfricaSouth AmericaSouth Central AsiaSouth Eastern AsiaSouthern EuropeSpainSri LankaSt. Vincent and the GrenadinesSudanSwedenSwitzerlandSyriaTaiwanThailandTrinidad and TobagoTurkeyUgandaUkraineUruguayUzbekistanVenezuelaVietnamWest IndiesWestern AfricaWestern AsiaWestern EuropeYemenZaireZimbabweAzores
Unemployment Among Women with Children Ages 6 to 17 years
Income
Poverty
Unemployment
Labor Participation
Family Structure
Vehicle Availability
Education Level
Disability

Unemployment Among Women with Children Ages 6 to 17 years Comparison

Immigrants from Africa

Africans

Tragic
Tragic
9.4%
UNEMPLOYMENT AMONG WOMEN WITH CHILDREN AGES 6 TO 17 YEARS
1.6/ 100
METRIC RATING
246th/ 347
METRIC RANK
10.4%
UNEMPLOYMENT AMONG WOMEN WITH CHILDREN AGES 6 TO 17 YEARS
0.0/ 100
METRIC RATING
312th/ 347
METRIC RANK

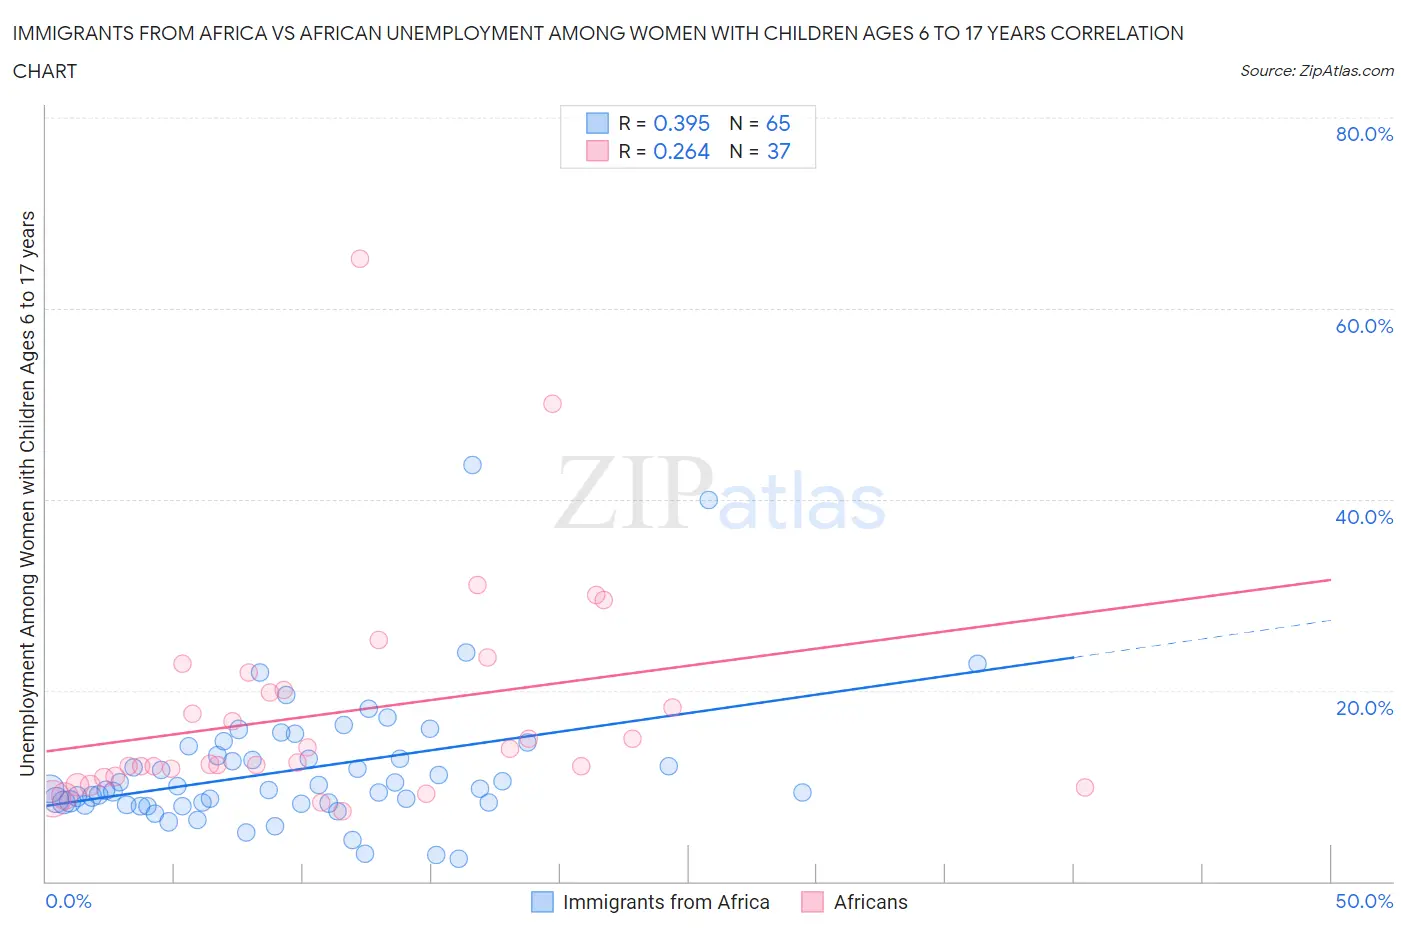
Immigrants from Africa vs African Unemployment Among Women with Children Ages 6 to 17 years Correlation Chart

The statistical analysis conducted on geographies consisting of 326,826,786 people shows a mild positive correlation between the proportion of Immigrants from Africa and unemployment rate among women with children between the ages 6 and 17 in the United States with a correlation coefficient (R) of 0.395 and weighted average of 9.4%. Similarly, the statistical analysis conducted on geographies consisting of 330,667,716 people shows a weak positive correlation between the proportion of Africans and unemployment rate among women with children between the ages 6 and 17 in the United States with a correlation coefficient (R) of 0.264 and weighted average of 10.4%, a difference of 10.9%.
Immigrants from Africa vs African Unemployment Among Women with Children Ages 6 to 17 years

Unemployment Among Women with Children Ages 6 to 17 years Correlation Summary

MeasurementImmigrants from AfricaAfrican
Minimum2.4%7.3%
Maximum43.6%65.2%
Range41.2%57.9%
Mean11.7%17.6%
Median9.6%12.5%
Interquartile 25% (IQ1)8.1%10.9%
Interquartile 75% (IQ3)13.7%21.0%
Interquartile Range (IQR)5.5%10.1%
Standard Deviation (Sample)7.0%11.7%
Standard Deviation (Population)7.0%11.5%

Similar Demographics by Unemployment Among Women with Children Ages 6 to 17 years

Demographics Similar to Immigrants from Africa by Unemployment Among Women with Children Ages 6 to 17 years

In terms of unemployment among women with children ages 6 to 17 years, the demographic groups most similar to Immigrants from Africa are Polish (9.4%, a difference of 0.030%), Dutch (9.4%, a difference of 0.070%), Immigrants from South America (9.4%, a difference of 0.080%), Immigrants from Cameroon (9.4%, a difference of 0.17%), and Immigrants from Guatemala (9.4%, a difference of 0.17%).
DemographicsRating | RankUnemployment Among Women with Children Ages 6 to 17 years
Immigrants | Saudi Arabia
2.7
/100
|
#239
Tragic
9.3%
Guatemalans
2.3
/100
|
#240
Tragic
9.3%
Colombians
2.2
/100
|
#241
Tragic
9.3%
Immigrants | Colombia
2.1
/100
|
#242
Tragic
9.3%
Scottish
2.0
/100
|
#243
Tragic
9.4%
English
1.9
/100
|
#244
Tragic
9.4%
Immigrants | Cameroon
1.8
/100
|
#245
Tragic
9.4%
Immigrants | Africa
1.6
/100
|
#246
Tragic
9.4%
Poles
1.5
/100
|
#247
Tragic
9.4%
Dutch
1.5
/100
|
#248
Tragic
9.4%
Immigrants | South America
1.5
/100
|
#249
Tragic
9.4%
Immigrants | Guatemala
1.3
/100
|
#250
Tragic
9.4%
Central Americans
1.3
/100
|
#251
Tragic
9.4%
Creek
1.2
/100
|
#252
Tragic
9.4%
Portuguese
1.1
/100
|
#253
Tragic
9.4%

Demographics Similar to Africans by Unemployment Among Women with Children Ages 6 to 17 years

In terms of unemployment among women with children ages 6 to 17 years, the demographic groups most similar to Africans are American (10.4%, a difference of 0.18%), Immigrants from Cabo Verde (10.4%, a difference of 0.23%), Bahamian (10.4%, a difference of 0.26%), Immigrants from Liberia (10.3%, a difference of 0.84%), and Alaska Native (10.3%, a difference of 0.87%).
DemographicsRating | RankUnemployment Among Women with Children Ages 6 to 17 years
Immigrants | Nigeria
0.0
/100
|
#305
Tragic
10.2%
Paraguayans
0.0
/100
|
#306
Tragic
10.2%
Immigrants | Senegal
0.0
/100
|
#307
Tragic
10.2%
Dutch West Indians
0.0
/100
|
#308
Tragic
10.2%
French Canadians
0.0
/100
|
#309
Tragic
10.3%
Alaska Natives
0.0
/100
|
#310
Tragic
10.3%
Immigrants | Liberia
0.0
/100
|
#311
Tragic
10.3%
Africans
0.0
/100
|
#312
Tragic
10.4%
Americans
0.0
/100
|
#313
Tragic
10.4%
Immigrants | Cabo Verde
0.0
/100
|
#314
Tragic
10.4%
Bahamians
0.0
/100
|
#315
Tragic
10.4%
Immigrants | Dominica
0.0
/100
|
#316
Tragic
10.5%
Bermudans
0.0
/100
|
#317
Tragic
10.5%
Delaware
0.0
/100
|
#318
Tragic
10.5%
Immigrants | Uganda
0.0
/100
|
#319
Tragic
10.7%