Immigrants from Afghanistan vs Immigrants from St. Vincent and the Grenadines Unemployment Among Ages 16 to 19 years
COMPARE
Immigrants from Afghanistan
Immigrants from St. Vincent and the Grenadines
Unemployment Among Ages 16 to 19 years
Unemployment Among Ages 16 to 19 years Comparison
Immigrants from Afghanistan
Immigrants from St. Vincent and the Grenadines
17.4%
UNEMPLOYMENT AMONG AGES 16 TO 19 YEARS
68.6/ 100
METRIC RATING
153rd/ 347
METRIC RANK
25.7%
UNEMPLOYMENT AMONG AGES 16 TO 19 YEARS
0.0/ 100
METRIC RATING
338th/ 347
METRIC RANK
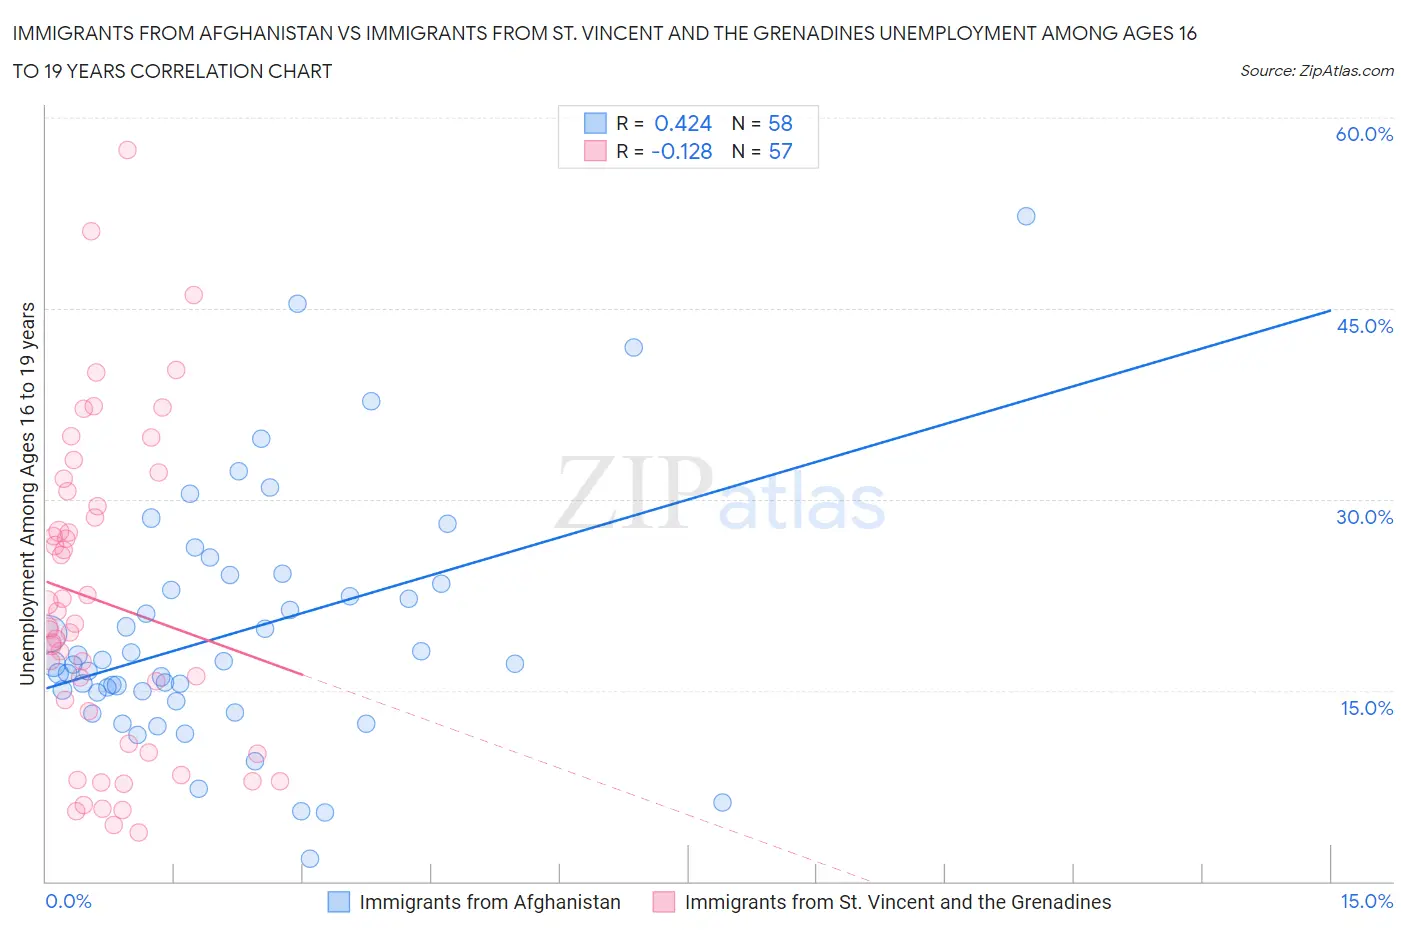
Immigrants from Afghanistan vs Immigrants from St. Vincent and the Grenadines Unemployment Among Ages 16 to 19 years Correlation Chart
The statistical analysis conducted on geographies consisting of 144,797,904 people shows a moderate positive correlation between the proportion of Immigrants from Afghanistan and unemployment rate among population between the ages 16 and 19 in the United States with a correlation coefficient (R) of 0.424 and weighted average of 17.4%. Similarly, the statistical analysis conducted on geographies consisting of 55,670,262 people shows a poor negative correlation between the proportion of Immigrants from St. Vincent and the Grenadines and unemployment rate among population between the ages 16 and 19 in the United States with a correlation coefficient (R) of -0.128 and weighted average of 25.7%, a difference of 47.5%.
Unemployment Among Ages 16 to 19 years Correlation Summary
| Measurement | Immigrants from Afghanistan | Immigrants from St. Vincent and the Grenadines |
| Minimum | 1.8% | 3.8% |
| Maximum | 52.2% | 57.4% |
| Range | 50.4% | 53.6% |
| Mean | 19.5% | 21.9% |
| Median | 17.1% | 20.0% |
| Interquartile 25% (IQ1) | 14.9% | 10.4% |
| Interquartile 75% (IQ3) | 23.4% | 30.1% |
| Interquartile Range (IQR) | 8.5% | 19.6% |
| Standard Deviation (Sample) | 9.7% | 12.4% |
| Standard Deviation (Population) | 9.6% | 12.3% |
Similar Demographics by Unemployment Among Ages 16 to 19 years
Demographics Similar to Immigrants from Afghanistan by Unemployment Among Ages 16 to 19 years
In terms of unemployment among ages 16 to 19 years, the demographic groups most similar to Immigrants from Afghanistan are Immigrants from Northern Africa (17.4%, a difference of 0.020%), Afghan (17.4%, a difference of 0.020%), Immigrants from Hong Kong (17.4%, a difference of 0.040%), Portuguese (17.4%, a difference of 0.070%), and Costa Rican (17.4%, a difference of 0.14%).
| Demographics | Rating | Rank | Unemployment Among Ages 16 to 19 years |
| Turks | 77.1 /100 | #146 | Good 17.3% |
| Tsimshian | 76.0 /100 | #147 | Good 17.3% |
| Romanians | 74.9 /100 | #148 | Good 17.3% |
| Immigrants | Eastern Asia | 73.8 /100 | #149 | Good 17.4% |
| Immigrants | Northern Europe | 72.5 /100 | #150 | Good 17.4% |
| Immigrants | Hong Kong | 69.3 /100 | #151 | Good 17.4% |
| Immigrants | Northern Africa | 69.0 /100 | #152 | Good 17.4% |
| Immigrants | Afghanistan | 68.6 /100 | #153 | Good 17.4% |
| Afghans | 68.1 /100 | #154 | Good 17.4% |
| Portuguese | 67.3 /100 | #155 | Good 17.4% |
| Costa Ricans | 65.9 /100 | #156 | Good 17.4% |
| Uruguayans | 64.3 /100 | #157 | Good 17.5% |
| Immigrants | China | 64.1 /100 | #158 | Good 17.5% |
| Koreans | 61.0 /100 | #159 | Good 17.5% |
| Ukrainians | 60.5 /100 | #160 | Good 17.5% |
Demographics Similar to Immigrants from St. Vincent and the Grenadines by Unemployment Among Ages 16 to 19 years
In terms of unemployment among ages 16 to 19 years, the demographic groups most similar to Immigrants from St. Vincent and the Grenadines are Immigrants from Grenada (25.7%, a difference of 0.19%), Immigrants from Guyana (25.5%, a difference of 0.81%), Kiowa (25.2%, a difference of 1.9%), Crow (26.2%, a difference of 2.1%), and Arapaho (25.2%, a difference of 2.1%).
| Demographics | Rating | Rank | Unemployment Among Ages 16 to 19 years |
| British West Indians | 0.0 /100 | #331 | Tragic 24.0% |
| Immigrants | Barbados | 0.0 /100 | #332 | Tragic 24.0% |
| Paiute | 0.0 /100 | #333 | Tragic 24.4% |
| Guyanese | 0.0 /100 | #334 | Tragic 24.8% |
| Arapaho | 0.0 /100 | #335 | Tragic 25.2% |
| Kiowa | 0.0 /100 | #336 | Tragic 25.2% |
| Immigrants | Guyana | 0.0 /100 | #337 | Tragic 25.5% |
| Immigrants | St. Vincent and the Grenadines | 0.0 /100 | #338 | Tragic 25.7% |
| Immigrants | Grenada | 0.0 /100 | #339 | Tragic 25.7% |
| Crow | 0.0 /100 | #340 | Tragic 26.2% |
| Puerto Ricans | 0.0 /100 | #341 | Tragic 27.5% |
| Inupiat | 0.0 /100 | #342 | Tragic 28.1% |
| Navajo | 0.0 /100 | #343 | Tragic 29.0% |
| Colville | 0.0 /100 | #344 | Tragic 29.7% |
| Hopi | 0.0 /100 | #345 | Tragic 30.7% |