Icelander vs Mexican Unemployment Among Ages 20 to 24 years

COMPARE

Icelander
Race
Ancestry
AfghanAfricanAlaska NativeAlaskan AthabascanAlbanianAleutAlsatianAmericanApacheArabArapahoArgentineanArmenianAssyrian/Chaldean/SyriacAustralianAustrianBahamianBangladeshiBarbadianBasqueBelgianBelizeanBermudanBhutaneseBlackfeetBolivianBrazilianBritishBritish West IndianBulgarianBurmeseCajunCambodianCanadianCape VerdeanCarpatho RusynCelticCentral AmericanCentral American IndianCherokeeCheyenneChickasawChileanChineseChippewaChoctawColombianColvilleComancheCosta RicanCreeCreekCroatianCrowCubanCypriotCzechCzechoslovakianDanishDelawareDominicanDutchDutch West IndianEastern EuropeanEcuadorianEgyptianEnglishEstonianEthiopianEuropeanFijianFilipinoFinnishFrenchFrench American IndianFrench CanadianGermanGerman RussianGhanaianGreekGuamanian/ChamorroGuatemalanGuyaneseHaitianHmongHonduranHopiHoumaHungarianIcelanderIndian (Asian)IndonesianInupiatIranianIraqiIrishIroquoisIsraeliItalianJamaicanJapaneseJordanianKenyanKiowaKoreanLaotianLatvianLebaneseLiberianLithuanianLumbeeLuxembourgerMacedonianMalaysianMalteseMarshalleseMenomineeMexican American IndianMongolianMoroccanNative HawaiianNavajoNepaleseNew ZealanderNicaraguanNigerianNorthern EuropeanNorwegianOkinawanOsageOttawaPaiutePakistaniPalestinianPanamanianParaguayanPennsylvania GermanPeruvianPimaPolishPortuguesePotawatomiPuebloPuerto RicanPuget Sound SalishRomanianRussianSalvadoranSamoanScandinavianScotch-IrishScottishSeminoleSenegaleseSerbianShoshoneSierra LeoneanSiouxSlavicSlovakSloveneSomaliSouth AfricanSouth AmericanSouth American IndianSoviet UnionSpaniardSpanishSpanish AmericanSpanish American IndianSri LankanSubsaharan AfricanSudaneseSwedishSwissSyrianTaiwaneseThaiTlingit-HaidaTohono O'OdhamTonganTrinidadian and TobagonianTsimshianTurkishU.S. Virgin IslanderUgandanUkrainianUruguayanUteVenezuelanVietnameseWelshWest IndianYakamaYaquiYugoslavianYumanYup'ikZimbabwean
Immigration
NonimmigrantsImmigrantsAfghanistanAfricaAlbaniaArgentinaArmeniaAsiaAustraliaAustriaBahamasBangladeshBarbadosBelarusBelgiumBelizeBoliviaBosnia and HerzegovinaBrazilBulgariaBurma/MyanmarCabo VerdeCambodiaCameroonCanadaCaribbeanCentral AmericaChileChinaColombiaCongoCosta RicaCroatiaCubaCzechoslovakiaDenmarkDominicaDominican RepublicEastern AfricaEastern AsiaEastern EuropeEcuadorEgyptEl SalvadorEnglandEritreaEthiopiaEuropeFijiFranceGermanyGhanaGreeceGrenadaGuatemalaGuyanaHaitiHondurasHong KongHungaryIndiaIndonesiaIranIraqIrelandIsraelItalyJamaicaJapanJordanKazakhstanKenyaKoreaKuwaitLaosLatin AmericaLatviaLebanonLiberiaLithuaniaMalaysiaMexicoMicronesiaMiddle AfricaMoldovaMoroccoNepalNetherlandsNicaraguaNigeriaNorth AmericaNorth MacedoniaNorthern AfricaNorthern EuropeNorwayOceaniaPakistanPanamaPeruPhilippinesPolandPortugalRomaniaRussiaSaudi ArabiaScotlandSenegalSerbiaSierra LeoneSingaporeSomaliaSouth AfricaSouth AmericaSouth Central AsiaSouth Eastern AsiaSouthern EuropeSpainSri LankaSt. Vincent and the GrenadinesSudanSwedenSwitzerlandSyriaTaiwanThailandTrinidad and TobagoTurkeyUgandaUkraineUruguayUzbekistanVenezuelaVietnamWest IndiesWestern AfricaWestern AsiaWestern EuropeYemenZaireZimbabweAzores
Mexican
Race
Ancestry
AfghanAfricanAlaska NativeAlaskan AthabascanAlbanianAleutAlsatianAmericanApacheArabArapahoArgentineanArmenianAssyrian/Chaldean/SyriacAustralianAustrianBahamianBangladeshiBarbadianBasqueBelgianBelizeanBermudanBhutaneseBlackfeetBolivianBrazilianBritishBritish West IndianBulgarianBurmeseCajunCambodianCanadianCape VerdeanCarpatho RusynCelticCentral AmericanCentral American IndianCherokeeCheyenneChickasawChileanChineseChippewaChoctawColombianColvilleComancheCosta RicanCreeCreekCroatianCrowCubanCypriotCzechCzechoslovakianDanishDelawareDominicanDutchDutch West IndianEastern EuropeanEcuadorianEgyptianEnglishEstonianEthiopianEuropeanFijianFilipinoFinnishFrenchFrench American IndianFrench CanadianGermanGerman RussianGhanaianGreekGuamanian/ChamorroGuatemalanGuyaneseHaitianHmongHonduranHopiHoumaHungarianIndian (Asian)IndonesianInupiatIranianIraqiIrishIroquoisIsraeliItalianJamaicanJapaneseJordanianKenyanKiowaKoreanLaotianLatvianLebaneseLiberianLithuanianLumbeeLuxembourgerMacedonianMalaysianMalteseMarshalleseMenomineeMexicanMexican American IndianMongolianMoroccanNative HawaiianNavajoNepaleseNew ZealanderNicaraguanNigerianNorthern EuropeanNorwegianOkinawanOsageOttawaPaiutePakistaniPalestinianPanamanianParaguayanPennsylvania GermanPeruvianPimaPolishPortuguesePotawatomiPuebloPuerto RicanPuget Sound SalishRomanianRussianSalvadoranSamoanScandinavianScotch-IrishScottishSeminoleSenegaleseSerbianShoshoneSierra LeoneanSiouxSlavicSlovakSloveneSomaliSouth AfricanSouth AmericanSouth American IndianSoviet UnionSpaniardSpanishSpanish AmericanSpanish American IndianSri LankanSubsaharan AfricanSudaneseSwedishSwissSyrianTaiwaneseThaiTlingit-HaidaTohono O'OdhamTonganTrinidadian and TobagonianTsimshianTurkishU.S. Virgin IslanderUgandanUkrainianUruguayanUteVenezuelanVietnameseWelshWest IndianYakamaYaquiYugoslavianYumanYup'ikZimbabwean
Immigration
NonimmigrantsImmigrantsAfghanistanAfricaAlbaniaArgentinaArmeniaAsiaAustraliaAustriaBahamasBangladeshBarbadosBelarusBelgiumBelizeBoliviaBosnia and HerzegovinaBrazilBulgariaBurma/MyanmarCabo VerdeCambodiaCameroonCanadaCaribbeanCentral AmericaChileChinaColombiaCongoCosta RicaCroatiaCubaCzechoslovakiaDenmarkDominicaDominican RepublicEastern AfricaEastern AsiaEastern EuropeEcuadorEgyptEl SalvadorEnglandEritreaEthiopiaEuropeFijiFranceGermanyGhanaGreeceGrenadaGuatemalaGuyanaHaitiHondurasHong KongHungaryIndiaIndonesiaIranIraqIrelandIsraelItalyJamaicaJapanJordanKazakhstanKenyaKoreaKuwaitLaosLatin AmericaLatviaLebanonLiberiaLithuaniaMalaysiaMexicoMicronesiaMiddle AfricaMoldovaMoroccoNepalNetherlandsNicaraguaNigeriaNorth AmericaNorth MacedoniaNorthern AfricaNorthern EuropeNorwayOceaniaPakistanPanamaPeruPhilippinesPolandPortugalRomaniaRussiaSaudi ArabiaScotlandSenegalSerbiaSierra LeoneSingaporeSomaliaSouth AfricaSouth AmericaSouth Central AsiaSouth Eastern AsiaSouthern EuropeSpainSri LankaSt. Vincent and the GrenadinesSudanSwedenSwitzerlandSyriaTaiwanThailandTrinidad and TobagoTurkeyUgandaUkraineUruguayUzbekistanVenezuelaVietnamWest IndiesWestern AfricaWestern AsiaWestern EuropeYemenZaireZimbabweAzores
Unemployment Among Ages 20 to 24 years
Income
Poverty
Unemployment
Labor Participation
Family Structure
Vehicle Availability
Education Level
Disability

Unemployment Among Ages 20 to 24 years Comparison

Icelanders

Mexicans

Exceptional
Tragic
9.9%
UNEMPLOYMENT AMONG AGES 20 TO 24 YEARS
98.3/ 100
METRIC RATING
79th/ 347
METRIC RANK
10.6%
UNEMPLOYMENT AMONG AGES 20 TO 24 YEARS
3.2/ 100
METRIC RATING
236th/ 347
METRIC RANK

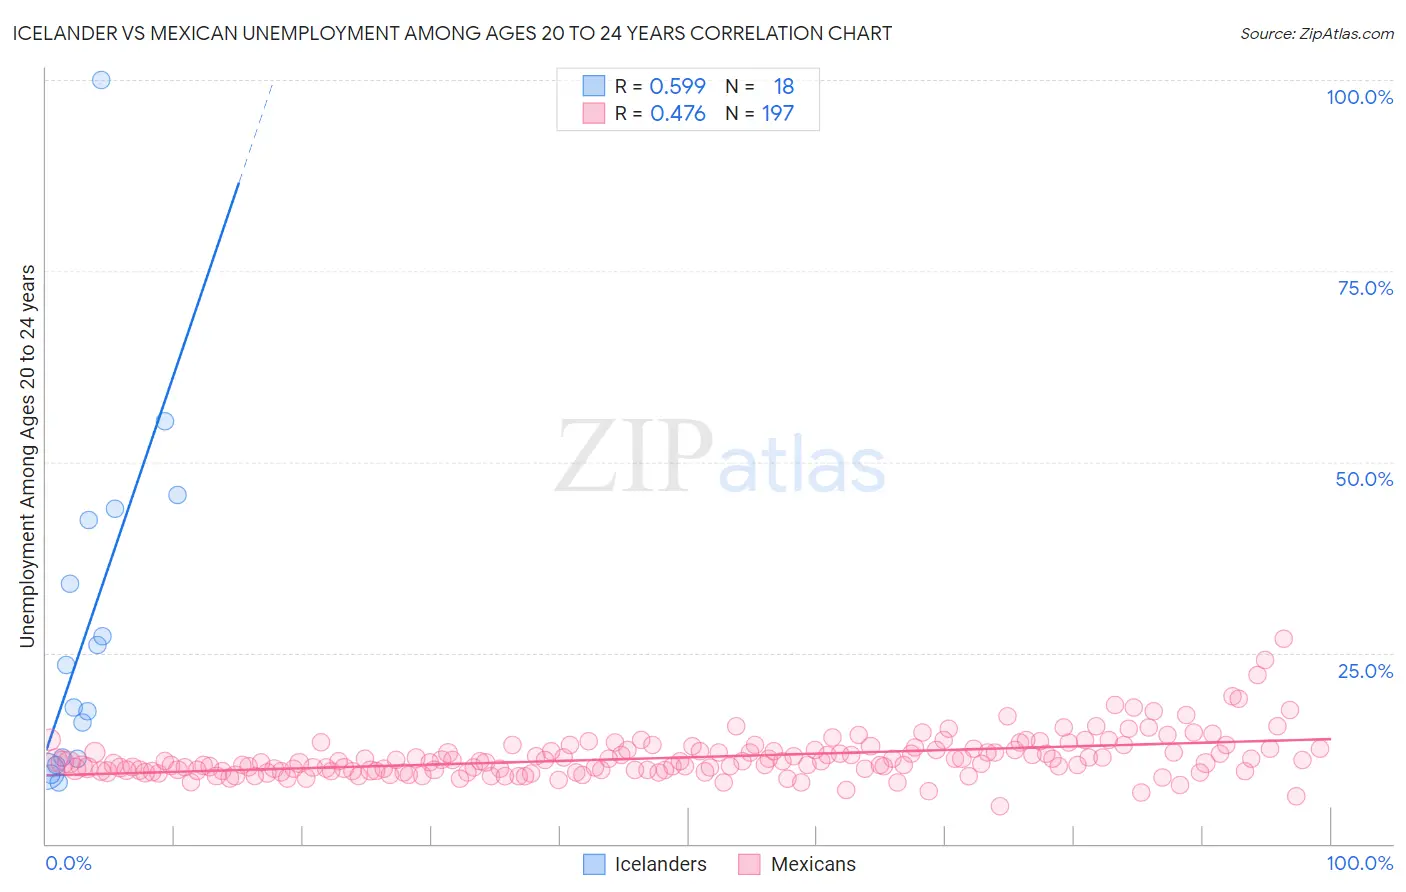
Icelander vs Mexican Unemployment Among Ages 20 to 24 years Correlation Chart

The statistical analysis conducted on geographies consisting of 156,553,400 people shows a substantial positive correlation between the proportion of Icelanders and unemployment rate among population between the ages 20 and 24 in the United States with a correlation coefficient (R) of 0.599 and weighted average of 9.9%. Similarly, the statistical analysis conducted on geographies consisting of 521,721,977 people shows a moderate positive correlation between the proportion of Mexicans and unemployment rate among population between the ages 20 and 24 in the United States with a correlation coefficient (R) of 0.476 and weighted average of 10.6%, a difference of 7.1%.
Icelander vs Mexican Unemployment Among Ages 20 to 24 years

Unemployment Among Ages 20 to 24 years Correlation Summary

MeasurementIcelanderMexican
Minimum8.0%4.9%
Maximum100.0%26.9%
Range92.0%21.9%
Mean28.2%11.3%
Median20.7%10.7%
Interquartile 25% (IQ1)11.1%9.6%
Interquartile 75% (IQ3)42.4%12.3%
Interquartile Range (IQR)31.3%2.7%
Standard Deviation (Sample)23.1%2.8%
Standard Deviation (Population)22.5%2.8%

Similar Demographics by Unemployment Among Ages 20 to 24 years

Demographics Similar to Icelanders by Unemployment Among Ages 20 to 24 years

In terms of unemployment among ages 20 to 24 years, the demographic groups most similar to Icelanders are Assyrian/Chaldean/Syriac (9.9%, a difference of 0.020%), Immigrants from Netherlands (9.9%, a difference of 0.040%), Chickasaw (9.9%, a difference of 0.050%), Czechoslovakian (9.9%, a difference of 0.070%), and Immigrants from Australia (9.9%, a difference of 0.16%).
DemographicsRating | RankUnemployment Among Ages 20 to 24 years
Bolivians
98.9
/100
|
#72
Exceptional
9.9%
Kenyans
98.7
/100
|
#73
Exceptional
9.9%
Immigrants | Laos
98.7
/100
|
#74
Exceptional
9.9%
Immigrants | Australia
98.6
/100
|
#75
Exceptional
9.9%
Czechoslovakians
98.4
/100
|
#76
Exceptional
9.9%
Chickasaw
98.4
/100
|
#77
Exceptional
9.9%
Assyrians/Chaldeans/Syriacs
98.3
/100
|
#78
Exceptional
9.9%
Icelanders
98.3
/100
|
#79
Exceptional
9.9%
Immigrants | Netherlands
98.2
/100
|
#80
Exceptional
9.9%
Yaqui
98.0
/100
|
#81
Exceptional
9.9%
Sri Lankans
98.0
/100
|
#82
Exceptional
9.9%
Immigrants | Bulgaria
98.0
/100
|
#83
Exceptional
9.9%
Latvians
97.9
/100
|
#84
Exceptional
9.9%
New Zealanders
97.8
/100
|
#85
Exceptional
9.9%
Immigrants | Vietnam
97.5
/100
|
#86
Exceptional
10.0%

Demographics Similar to Mexicans by Unemployment Among Ages 20 to 24 years

In terms of unemployment among ages 20 to 24 years, the demographic groups most similar to Mexicans are Immigrants from Ukraine (10.6%, a difference of 0.040%), Immigrants from Africa (10.6%, a difference of 0.090%), Choctaw (10.6%, a difference of 0.11%), Israeli (10.6%, a difference of 0.13%), and Immigrants (10.6%, a difference of 0.17%).
DemographicsRating | RankUnemployment Among Ages 20 to 24 years
Americans
4.4
/100
|
#229
Tragic
10.6%
French American Indians
4.1
/100
|
#230
Tragic
10.6%
Native Hawaiians
3.9
/100
|
#231
Tragic
10.6%
Israelis
3.7
/100
|
#232
Tragic
10.6%
Choctaw
3.6
/100
|
#233
Tragic
10.6%
Immigrants | Africa
3.5
/100
|
#234
Tragic
10.6%
Immigrants | Ukraine
3.3
/100
|
#235
Tragic
10.6%
Mexicans
3.2
/100
|
#236
Tragic
10.6%
Immigrants | Immigrants
2.7
/100
|
#237
Tragic
10.6%
Immigrants | Pakistan
2.6
/100
|
#238
Tragic
10.6%
Salvadorans
2.4
/100
|
#239
Tragic
10.7%
Immigrants | Central America
2.0
/100
|
#240
Tragic
10.7%
Immigrants | El Salvador
1.7
/100
|
#241
Tragic
10.7%
Moroccans
1.4
/100
|
#242
Tragic
10.7%
Immigrants | Belarus
1.3
/100
|
#243
Tragic
10.7%