Hungarian vs Yuman Unemployment Among Seniors over 75 years
COMPARE
Hungarian
Yuman
Unemployment Among Seniors over 75 years
Unemployment Among Seniors over 75 years Comparison
Hungarians
Yuman
10.1%
UNEMPLOYMENT AMONG SENIORS OVER 75 YEARS
0.0/ 100
METRIC RATING
310th/ 347
METRIC RANK
6.7%
UNEMPLOYMENT AMONG SENIORS OVER 75 YEARS
100.0/ 100
METRIC RATING
10th/ 347
METRIC RANK
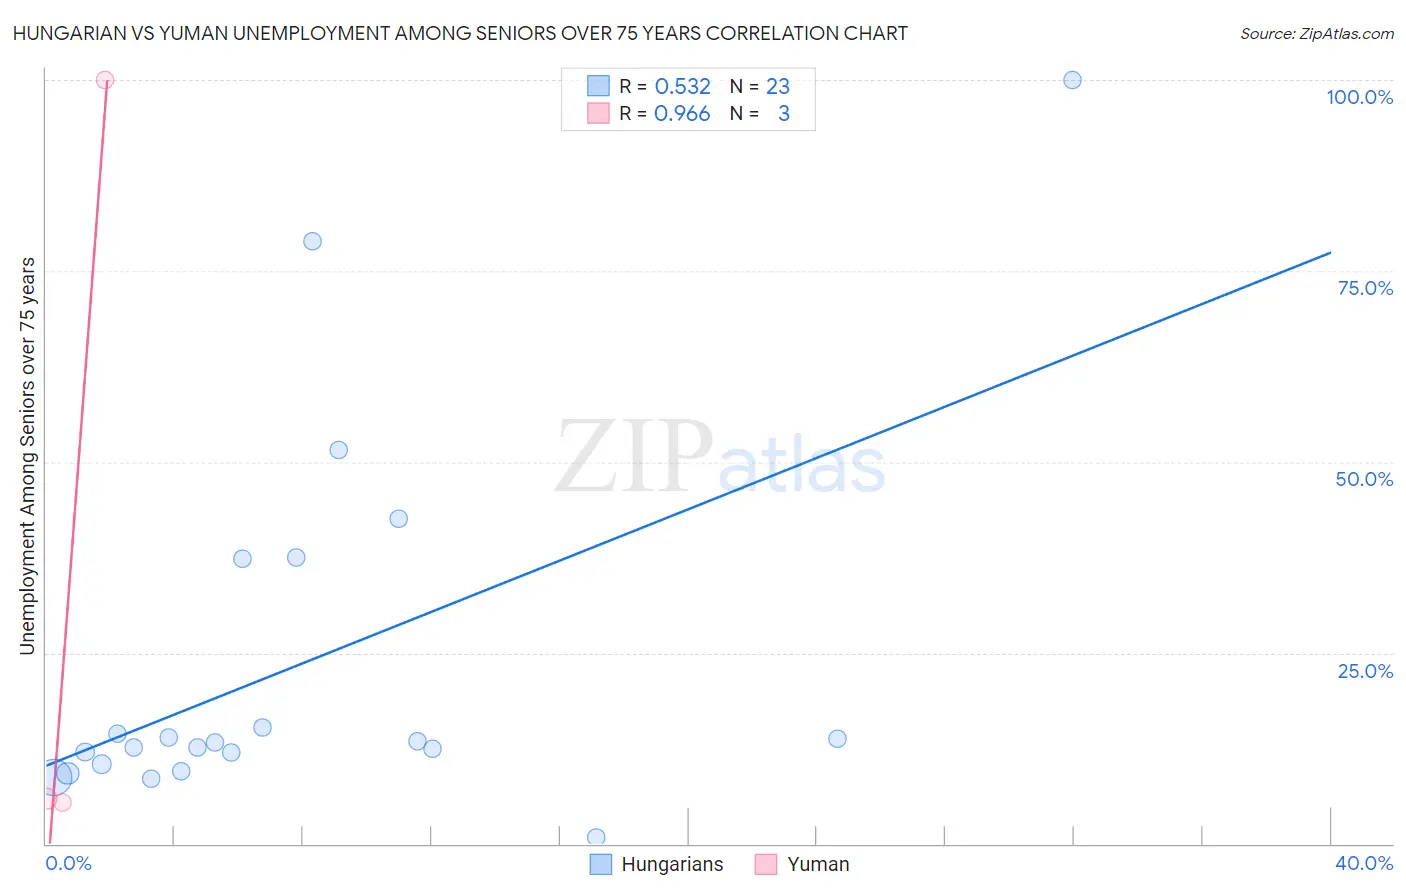
Hungarian vs Yuman Unemployment Among Seniors over 75 years Correlation Chart
The statistical analysis conducted on geographies consisting of 221,758,984 people shows a substantial positive correlation between the proportion of Hungarians and unemployment rate among seniors over the age of 75 in the United States with a correlation coefficient (R) of 0.532 and weighted average of 10.1%. Similarly, the statistical analysis conducted on geographies consisting of 34,222,991 people shows a perfect positive correlation between the proportion of Yuman and unemployment rate among seniors over the age of 75 in the United States with a correlation coefficient (R) of 0.966 and weighted average of 6.7%, a difference of 51.4%.
Unemployment Among Seniors over 75 years Correlation Summary
| Measurement | Hungarian | Yuman |
| Minimum | 0.90% | 5.4% |
| Maximum | 100.0% | 100.0% |
| Range | 99.1% | 94.6% |
| Mean | 23.5% | 37.1% |
| Median | 13.2% | 5.9% |
| Interquartile 25% (IQ1) | 10.4% | 5.4% |
| Interquartile 75% (IQ3) | 37.3% | 100.0% |
| Interquartile Range (IQR) | 26.9% | 94.6% |
| Standard Deviation (Sample) | 24.5% | 54.5% |
| Standard Deviation (Population) | 23.9% | 44.5% |
Similar Demographics by Unemployment Among Seniors over 75 years
Demographics Similar to Hungarians by Unemployment Among Seniors over 75 years
In terms of unemployment among seniors over 75 years, the demographic groups most similar to Hungarians are Scottish (10.1%, a difference of 0.11%), Chippewa (10.1%, a difference of 0.13%), English (10.1%, a difference of 0.19%), White/Caucasian (10.1%, a difference of 0.25%), and Nepalese (10.1%, a difference of 0.25%).
| Demographics | Rating | Rank | Unemployment Among Seniors over 75 years |
| Puget Sound Salish | 0.0 /100 | #303 | Tragic 10.0% |
| Scotch-Irish | 0.0 /100 | #304 | Tragic 10.0% |
| Swedes | 0.0 /100 | #305 | Tragic 10.0% |
| Italians | 0.0 /100 | #306 | Tragic 10.0% |
| Immigrants | Fiji | 0.0 /100 | #307 | Tragic 10.0% |
| Whites/Caucasians | 0.0 /100 | #308 | Tragic 10.1% |
| English | 0.0 /100 | #309 | Tragic 10.1% |
| Hungarians | 0.0 /100 | #310 | Tragic 10.1% |
| Scottish | 0.0 /100 | #311 | Tragic 10.1% |
| Chippewa | 0.0 /100 | #312 | Tragic 10.1% |
| Nepalese | 0.0 /100 | #313 | Tragic 10.1% |
| Dutch West Indians | 0.0 /100 | #314 | Tragic 10.2% |
| Pennsylvania Germans | 0.0 /100 | #315 | Tragic 10.2% |
| Natives/Alaskans | 0.0 /100 | #316 | Tragic 10.2% |
| Irish | 0.0 /100 | #317 | Tragic 10.2% |
Demographics Similar to Yuman by Unemployment Among Seniors over 75 years
In terms of unemployment among seniors over 75 years, the demographic groups most similar to Yuman are Immigrants from Grenada (6.7%, a difference of 0.10%), Soviet Union (6.6%, a difference of 0.22%), Comanche (6.7%, a difference of 0.23%), Immigrants from Congo (6.7%, a difference of 1.0%), and Taiwanese (6.6%, a difference of 1.5%).
| Demographics | Rating | Rank | Unemployment Among Seniors over 75 years |
| Cheyenne | 100.0 /100 | #3 | Exceptional 5.9% |
| Alsatians | 100.0 /100 | #4 | Exceptional 6.1% |
| Hopi | 100.0 /100 | #5 | Exceptional 6.3% |
| Immigrants | Armenia | 100.0 /100 | #6 | Exceptional 6.5% |
| Spanish American Indians | 100.0 /100 | #7 | Exceptional 6.5% |
| Taiwanese | 100.0 /100 | #8 | Exceptional 6.6% |
| Soviet Union | 100.0 /100 | #9 | Exceptional 6.6% |
| Yuman | 100.0 /100 | #10 | Exceptional 6.7% |
| Immigrants | Grenada | 100.0 /100 | #11 | Exceptional 6.7% |
| Comanche | 100.0 /100 | #12 | Exceptional 6.7% |
| Immigrants | Congo | 100.0 /100 | #13 | Exceptional 6.7% |
| Ute | 100.0 /100 | #14 | Exceptional 6.8% |
| Icelanders | 100.0 /100 | #15 | Exceptional 7.0% |
| Seminole | 100.0 /100 | #16 | Exceptional 7.1% |
| Immigrants | Switzerland | 100.0 /100 | #17 | Exceptional 7.2% |