Houma vs Russian Unemployment Among Ages 25 to 29 years
COMPARE
Houma
Russian
Unemployment Among Ages 25 to 29 years
Unemployment Among Ages 25 to 29 years Comparison
Houma
Russians
8.7%
UNEMPLOYMENT AMONG AGES 25 TO 29 YEARS
0.0/ 100
METRIC RATING
324th/ 347
METRIC RANK
6.6%
UNEMPLOYMENT AMONG AGES 25 TO 29 YEARS
51.3/ 100
METRIC RATING
173rd/ 347
METRIC RANK
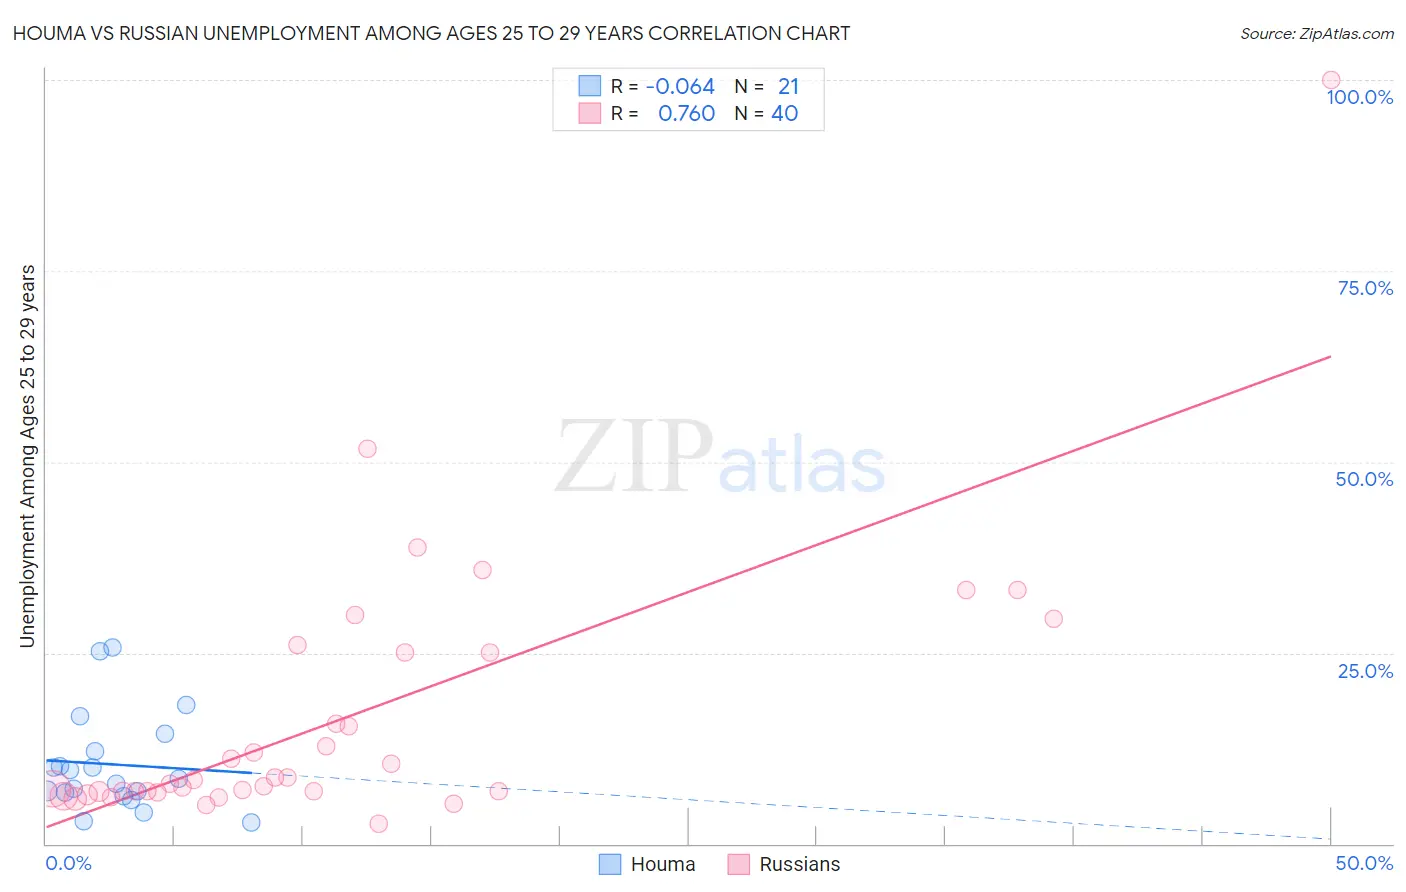
Houma vs Russian Unemployment Among Ages 25 to 29 years Correlation Chart
The statistical analysis conducted on geographies consisting of 36,263,529 people shows a slight negative correlation between the proportion of Houma and unemployment rate among population between the ages 25 and 29 in the United States with a correlation coefficient (R) of -0.064 and weighted average of 8.7%. Similarly, the statistical analysis conducted on geographies consisting of 468,496,515 people shows a strong positive correlation between the proportion of Russians and unemployment rate among population between the ages 25 and 29 in the United States with a correlation coefficient (R) of 0.760 and weighted average of 6.6%, a difference of 31.3%.
Unemployment Among Ages 25 to 29 years Correlation Summary
| Measurement | Houma | Russian |
| Minimum | 2.8% | 2.7% |
| Maximum | 25.8% | 100.0% |
| Range | 23.0% | 97.3% |
| Mean | 10.4% | 16.5% |
| Median | 8.5% | 8.1% |
| Interquartile 25% (IQ1) | 6.5% | 6.8% |
| Interquartile 75% (IQ3) | 13.3% | 25.0% |
| Interquartile Range (IQR) | 6.8% | 18.2% |
| Standard Deviation (Sample) | 6.4% | 18.0% |
| Standard Deviation (Population) | 6.3% | 17.7% |
Similar Demographics by Unemployment Among Ages 25 to 29 years
Demographics Similar to Houma by Unemployment Among Ages 25 to 29 years
In terms of unemployment among ages 25 to 29 years, the demographic groups most similar to Houma are Dominican (8.7%, a difference of 0.36%), Tlingit-Haida (8.7%, a difference of 0.45%), Yakama (8.8%, a difference of 0.51%), Immigrants from Dominican Republic (8.6%, a difference of 1.2%), and Black/African American (8.6%, a difference of 1.9%).
| Demographics | Rating | Rank | Unemployment Among Ages 25 to 29 years |
| Immigrants | Guyana | 0.0 /100 | #317 | Tragic 8.5% |
| Guyanese | 0.0 /100 | #318 | Tragic 8.5% |
| Immigrants | Armenia | 0.0 /100 | #319 | Tragic 8.5% |
| Blacks/African Americans | 0.0 /100 | #320 | Tragic 8.6% |
| Immigrants | Dominican Republic | 0.0 /100 | #321 | Tragic 8.6% |
| Tlingit-Haida | 0.0 /100 | #322 | Tragic 8.7% |
| Dominicans | 0.0 /100 | #323 | Tragic 8.7% |
| Houma | 0.0 /100 | #324 | Tragic 8.7% |
| Yakama | 0.0 /100 | #325 | Tragic 8.8% |
| Shoshone | 0.0 /100 | #326 | Tragic 9.2% |
| Colville | 0.0 /100 | #327 | Tragic 9.2% |
| Apache | 0.0 /100 | #328 | Tragic 9.5% |
| Aleuts | 0.0 /100 | #329 | Tragic 9.7% |
| Natives/Alaskans | 0.0 /100 | #330 | Tragic 9.8% |
| Alaska Natives | 0.0 /100 | #331 | Tragic 10.2% |
Demographics Similar to Russians by Unemployment Among Ages 25 to 29 years
In terms of unemployment among ages 25 to 29 years, the demographic groups most similar to Russians are Bangladeshi (6.6%, a difference of 0.020%), Immigrants from Cambodia (6.6%, a difference of 0.080%), Immigrants from North America (6.6%, a difference of 0.080%), Immigrants from South Eastern Asia (6.7%, a difference of 0.13%), and Albanian (6.6%, a difference of 0.14%).
| Demographics | Rating | Rank | Unemployment Among Ages 25 to 29 years |
| Immigrants | Northern Europe | 57.3 /100 | #166 | Average 6.6% |
| Immigrants | Canada | 55.0 /100 | #167 | Average 6.6% |
| Estonians | 54.8 /100 | #168 | Average 6.6% |
| South Americans | 54.5 /100 | #169 | Average 6.6% |
| Albanians | 53.5 /100 | #170 | Average 6.6% |
| Immigrants | Cambodia | 52.6 /100 | #171 | Average 6.6% |
| Bangladeshis | 51.6 /100 | #172 | Average 6.6% |
| Russians | 51.3 /100 | #173 | Average 6.6% |
| Immigrants | North America | 50.0 /100 | #174 | Average 6.6% |
| Immigrants | South Eastern Asia | 49.1 /100 | #175 | Average 6.7% |
| Osage | 48.1 /100 | #176 | Average 6.7% |
| Immigrants | Israel | 47.8 /100 | #177 | Average 6.7% |
| Immigrants | Iraq | 45.1 /100 | #178 | Average 6.7% |
| Costa Ricans | 44.9 /100 | #179 | Average 6.7% |
| Immigrants | Africa | 41.1 /100 | #180 | Average 6.7% |