Houma vs Immigrants from Japan Unemployment Among Women with Children Under 6 years
COMPARE
Houma
Immigrants from Japan
Unemployment Among Women with Children Under 6 years
Unemployment Among Women with Children Under 6 years Comparison
Houma
Immigrants from Japan
9.4%
UNEMPLOYMENT AMONG WOMEN WITH CHILDREN UNDER 6 YEARS
0.0/ 100
METRIC RATING
316th/ 347
METRIC RANK
6.5%
UNEMPLOYMENT AMONG WOMEN WITH CHILDREN UNDER 6 YEARS
100.0/ 100
METRIC RATING
27th/ 347
METRIC RANK
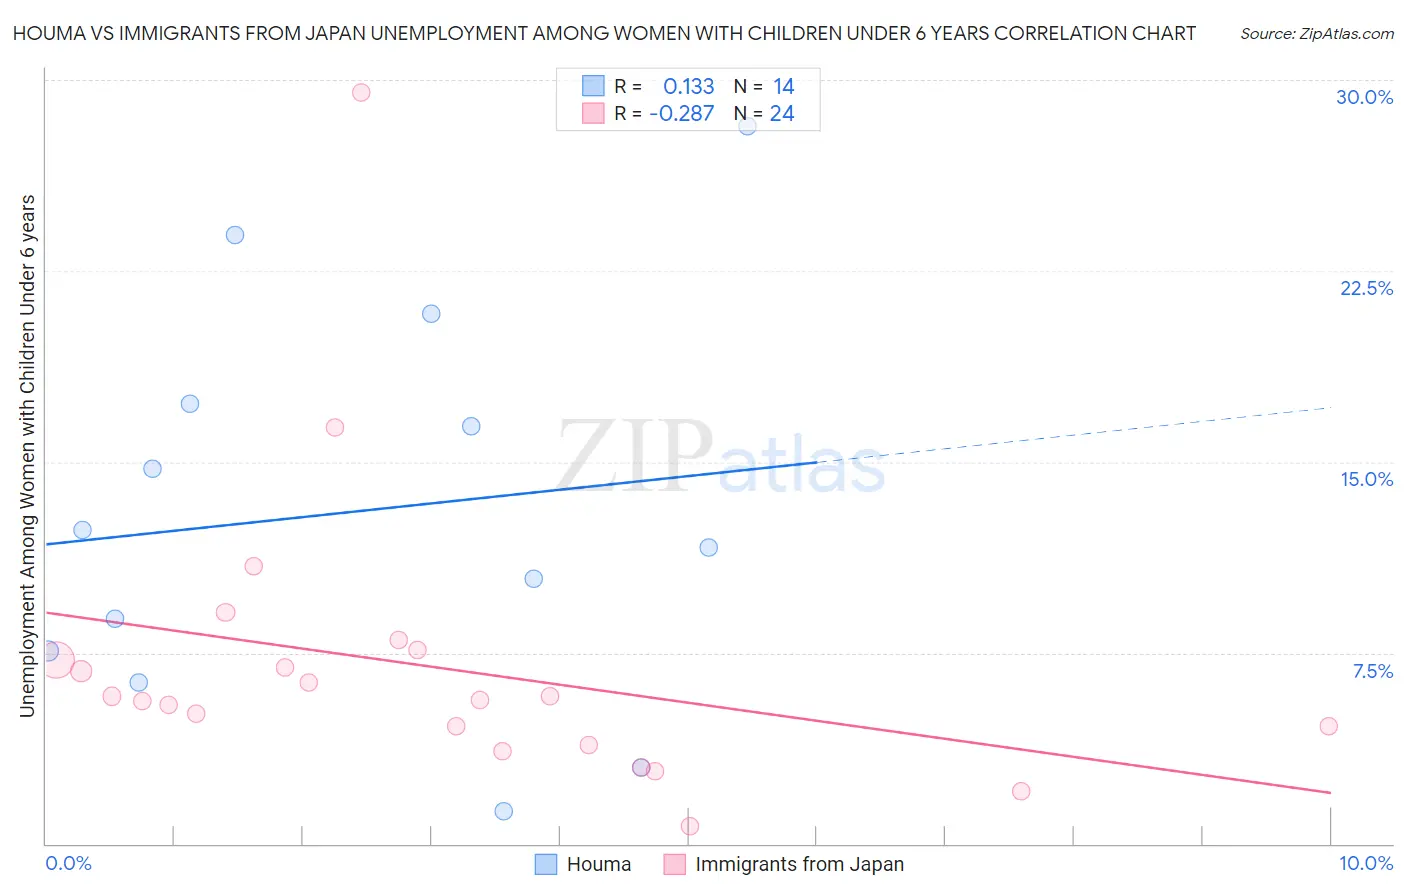
Houma vs Immigrants from Japan Unemployment Among Women with Children Under 6 years Correlation Chart
The statistical analysis conducted on geographies consisting of 34,510,951 people shows a poor positive correlation between the proportion of Houma and unemployment rate among women with children under the age of 6 in the United States with a correlation coefficient (R) of 0.133 and weighted average of 9.4%. Similarly, the statistical analysis conducted on geographies consisting of 268,694,372 people shows a weak negative correlation between the proportion of Immigrants from Japan and unemployment rate among women with children under the age of 6 in the United States with a correlation coefficient (R) of -0.287 and weighted average of 6.5%, a difference of 43.7%.
Unemployment Among Women with Children Under 6 years Correlation Summary
| Measurement | Houma | Immigrants from Japan |
| Minimum | 1.3% | 0.70% |
| Maximum | 28.2% | 29.5% |
| Range | 26.9% | 28.8% |
| Mean | 13.1% | 7.0% |
| Median | 12.0% | 5.7% |
| Interquartile 25% (IQ1) | 7.6% | 4.3% |
| Interquartile 75% (IQ3) | 17.3% | 7.4% |
| Interquartile Range (IQR) | 9.7% | 3.2% |
| Standard Deviation (Sample) | 7.7% | 5.7% |
| Standard Deviation (Population) | 7.5% | 5.6% |
Similar Demographics by Unemployment Among Women with Children Under 6 years
Demographics Similar to Houma by Unemployment Among Women with Children Under 6 years
In terms of unemployment among women with children under 6 years, the demographic groups most similar to Houma are Cherokee (9.3%, a difference of 0.78%), Dutch West Indian (9.5%, a difference of 0.79%), Osage (9.5%, a difference of 0.85%), Fijian (9.3%, a difference of 1.6%), and American (9.3%, a difference of 1.6%).
| Demographics | Rating | Rank | Unemployment Among Women with Children Under 6 years |
| Africans | 0.0 /100 | #309 | Tragic 9.2% |
| Cajuns | 0.0 /100 | #310 | Tragic 9.2% |
| French American Indians | 0.0 /100 | #311 | Tragic 9.2% |
| Immigrants | Azores | 0.0 /100 | #312 | Tragic 9.2% |
| Americans | 0.0 /100 | #313 | Tragic 9.3% |
| Fijians | 0.0 /100 | #314 | Tragic 9.3% |
| Cherokee | 0.0 /100 | #315 | Tragic 9.3% |
| Houma | 0.0 /100 | #316 | Tragic 9.4% |
| Dutch West Indians | 0.0 /100 | #317 | Tragic 9.5% |
| Osage | 0.0 /100 | #318 | Tragic 9.5% |
| Marshallese | 0.0 /100 | #319 | Tragic 9.6% |
| Potawatomi | 0.0 /100 | #320 | Tragic 9.6% |
| Central American Indians | 0.0 /100 | #321 | Tragic 9.6% |
| Alaska Natives | 0.0 /100 | #322 | Tragic 9.6% |
| Immigrants | Bahamas | 0.0 /100 | #323 | Tragic 9.6% |
Demographics Similar to Immigrants from Japan by Unemployment Among Women with Children Under 6 years
In terms of unemployment among women with children under 6 years, the demographic groups most similar to Immigrants from Japan are Immigrants from Israel (6.5%, a difference of 0.020%), Cypriot (6.5%, a difference of 0.10%), Soviet Union (6.5%, a difference of 0.18%), Laotian (6.5%, a difference of 0.20%), and Immigrants from Sweden (6.6%, a difference of 0.28%).
| Demographics | Rating | Rank | Unemployment Among Women with Children Under 6 years |
| Ute | 100.0 /100 | #20 | Exceptional 6.5% |
| Burmese | 100.0 /100 | #21 | Exceptional 6.5% |
| Immigrants | Korea | 100.0 /100 | #22 | Exceptional 6.5% |
| Bulgarians | 100.0 /100 | #23 | Exceptional 6.5% |
| Laotians | 100.0 /100 | #24 | Exceptional 6.5% |
| Soviet Union | 100.0 /100 | #25 | Exceptional 6.5% |
| Cypriots | 100.0 /100 | #26 | Exceptional 6.5% |
| Immigrants | Japan | 100.0 /100 | #27 | Exceptional 6.5% |
| Immigrants | Israel | 100.0 /100 | #28 | Exceptional 6.5% |
| Immigrants | Sweden | 100.0 /100 | #29 | Exceptional 6.6% |
| Immigrants | Belarus | 100.0 /100 | #30 | Exceptional 6.6% |
| Immigrants | Moldova | 100.0 /100 | #31 | Exceptional 6.6% |
| Tsimshian | 100.0 /100 | #32 | Exceptional 6.6% |
| Immigrants | Vietnam | 100.0 /100 | #33 | Exceptional 6.6% |
| Immigrants | South Central Asia | 100.0 /100 | #34 | Exceptional 6.6% |