Houma vs Colville Unemployment Among Ages 16 to 19 years
COMPARE
Houma
Colville
Unemployment Among Ages 16 to 19 years
Unemployment Among Ages 16 to 19 years Comparison
Houma
Colville
21.6%
UNEMPLOYMENT AMONG AGES 16 TO 19 YEARS
0.0/ 100
METRIC RATING
312th/ 347
METRIC RANK
29.7%
UNEMPLOYMENT AMONG AGES 16 TO 19 YEARS
0.0/ 100
METRIC RATING
344th/ 347
METRIC RANK
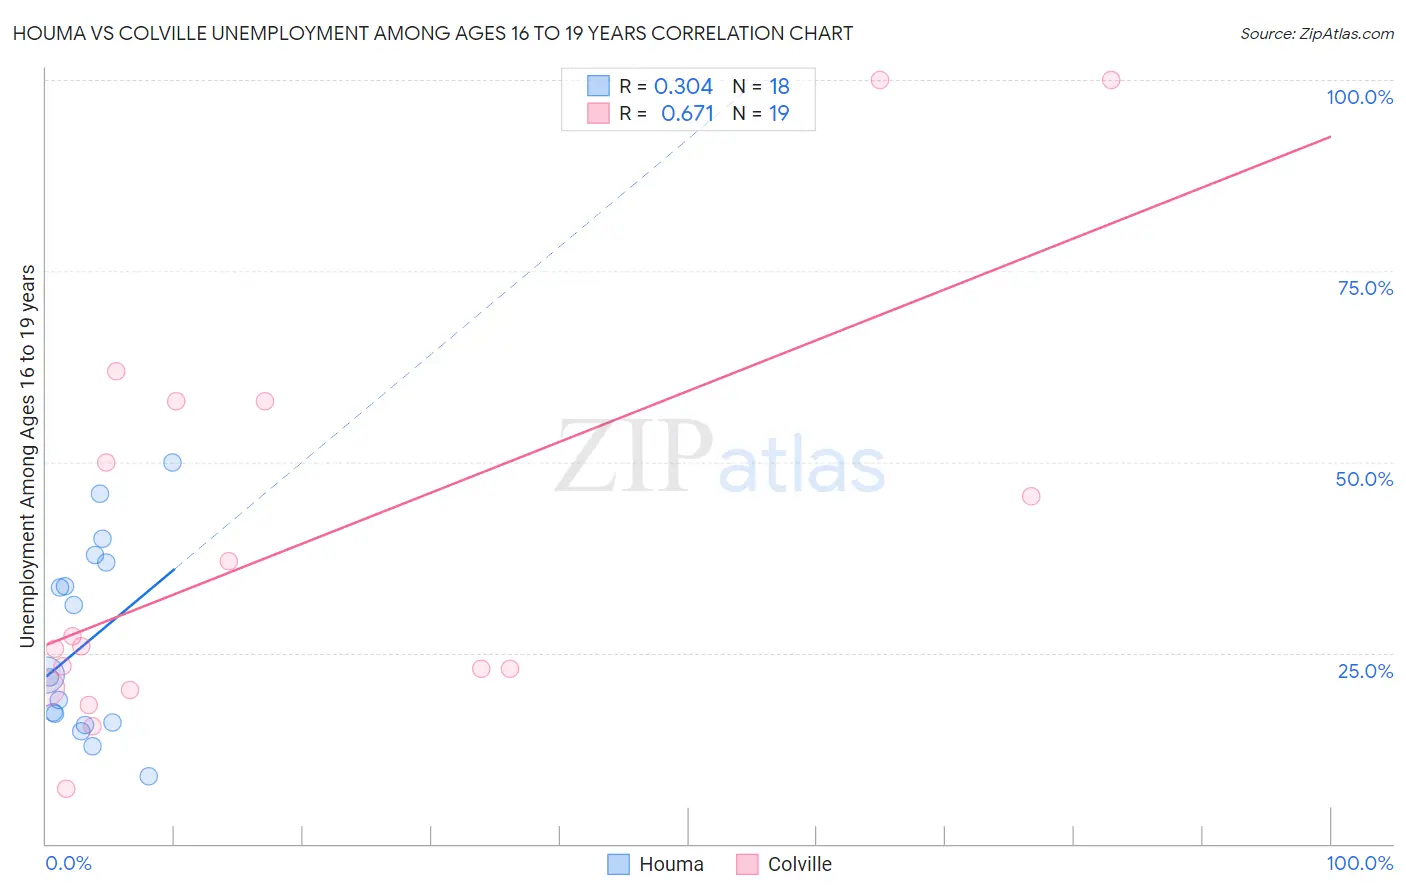
Houma vs Colville Unemployment Among Ages 16 to 19 years Correlation Chart
The statistical analysis conducted on geographies consisting of 36,075,381 people shows a mild positive correlation between the proportion of Houma and unemployment rate among population between the ages 16 and 19 in the United States with a correlation coefficient (R) of 0.304 and weighted average of 21.6%. Similarly, the statistical analysis conducted on geographies consisting of 34,302,836 people shows a significant positive correlation between the proportion of Colville and unemployment rate among population between the ages 16 and 19 in the United States with a correlation coefficient (R) of 0.671 and weighted average of 29.7%, a difference of 37.2%.
Unemployment Among Ages 16 to 19 years Correlation Summary
| Measurement | Houma | Colville |
| Minimum | 8.8% | 7.1% |
| Maximum | 50.0% | 100.0% |
| Range | 41.2% | 92.9% |
| Mean | 26.3% | 38.9% |
| Median | 21.9% | 25.9% |
| Interquartile 25% (IQ1) | 15.9% | 20.3% |
| Interquartile 75% (IQ3) | 36.9% | 57.9% |
| Interquartile Range (IQR) | 21.0% | 37.6% |
| Standard Deviation (Sample) | 12.4% | 26.7% |
| Standard Deviation (Population) | 12.1% | 26.0% |
Similar Demographics by Unemployment Among Ages 16 to 19 years
Demographics Similar to Houma by Unemployment Among Ages 16 to 19 years
In terms of unemployment among ages 16 to 19 years, the demographic groups most similar to Houma are Belizean (21.6%, a difference of 0.26%), Jamaican (21.7%, a difference of 0.41%), Vietnamese (21.5%, a difference of 0.48%), Native/Alaskan (21.5%, a difference of 0.54%), and Alaska Native (21.8%, a difference of 0.58%).
| Demographics | Rating | Rank | Unemployment Among Ages 16 to 19 years |
| Immigrants | Senegal | 0.0 /100 | #305 | Tragic 21.2% |
| U.S. Virgin Islanders | 0.0 /100 | #306 | Tragic 21.3% |
| Blacks/African Americans | 0.0 /100 | #307 | Tragic 21.4% |
| Immigrants | Bangladesh | 0.0 /100 | #308 | Tragic 21.5% |
| Natives/Alaskans | 0.0 /100 | #309 | Tragic 21.5% |
| Vietnamese | 0.0 /100 | #310 | Tragic 21.5% |
| Belizeans | 0.0 /100 | #311 | Tragic 21.6% |
| Houma | 0.0 /100 | #312 | Tragic 21.6% |
| Jamaicans | 0.0 /100 | #313 | Tragic 21.7% |
| Alaska Natives | 0.0 /100 | #314 | Tragic 21.8% |
| Immigrants | Dominica | 0.0 /100 | #315 | Tragic 21.9% |
| Tohono O'odham | 0.0 /100 | #316 | Tragic 22.1% |
| Immigrants | Belize | 0.0 /100 | #317 | Tragic 22.2% |
| Immigrants | Jamaica | 0.0 /100 | #318 | Tragic 22.2% |
| Immigrants | West Indies | 0.0 /100 | #319 | Tragic 22.2% |
Demographics Similar to Colville by Unemployment Among Ages 16 to 19 years
In terms of unemployment among ages 16 to 19 years, the demographic groups most similar to Colville are Navajo (29.0%, a difference of 2.2%), Hopi (30.7%, a difference of 3.3%), Inupiat (28.1%, a difference of 5.8%), Puerto Rican (27.5%, a difference of 7.9%), and Crow (26.2%, a difference of 13.1%).
| Demographics | Rating | Rank | Unemployment Among Ages 16 to 19 years |
| Paiute | 0.0 /100 | #333 | Tragic 24.4% |
| Guyanese | 0.0 /100 | #334 | Tragic 24.8% |
| Arapaho | 0.0 /100 | #335 | Tragic 25.2% |
| Kiowa | 0.0 /100 | #336 | Tragic 25.2% |
| Immigrants | Guyana | 0.0 /100 | #337 | Tragic 25.5% |
| Immigrants | St. Vincent and the Grenadines | 0.0 /100 | #338 | Tragic 25.7% |
| Immigrants | Grenada | 0.0 /100 | #339 | Tragic 25.7% |
| Crow | 0.0 /100 | #340 | Tragic 26.2% |
| Puerto Ricans | 0.0 /100 | #341 | Tragic 27.5% |
| Inupiat | 0.0 /100 | #342 | Tragic 28.1% |
| Navajo | 0.0 /100 | #343 | Tragic 29.0% |
| Colville | 0.0 /100 | #344 | Tragic 29.7% |
| Hopi | 0.0 /100 | #345 | Tragic 30.7% |
| Yuman | 0.0 /100 | #346 | Tragic 37.4% |
| Yup'ik | 0.0 /100 | #347 | Tragic 41.0% |