Honduran vs Palestinian Unemployment Among Seniors over 65 years
COMPARE
Honduran
Palestinian
Unemployment Among Seniors over 65 years
Unemployment Among Seniors over 65 years Comparison
Hondurans
Palestinians
5.3%
UNEMPLOYMENT AMONG SENIORS OVER 65 YEARS
5.6/ 100
METRIC RATING
225th/ 347
METRIC RANK
4.8%
UNEMPLOYMENT AMONG SENIORS OVER 65 YEARS
100.0/ 100
METRIC RATING
33rd/ 347
METRIC RANK
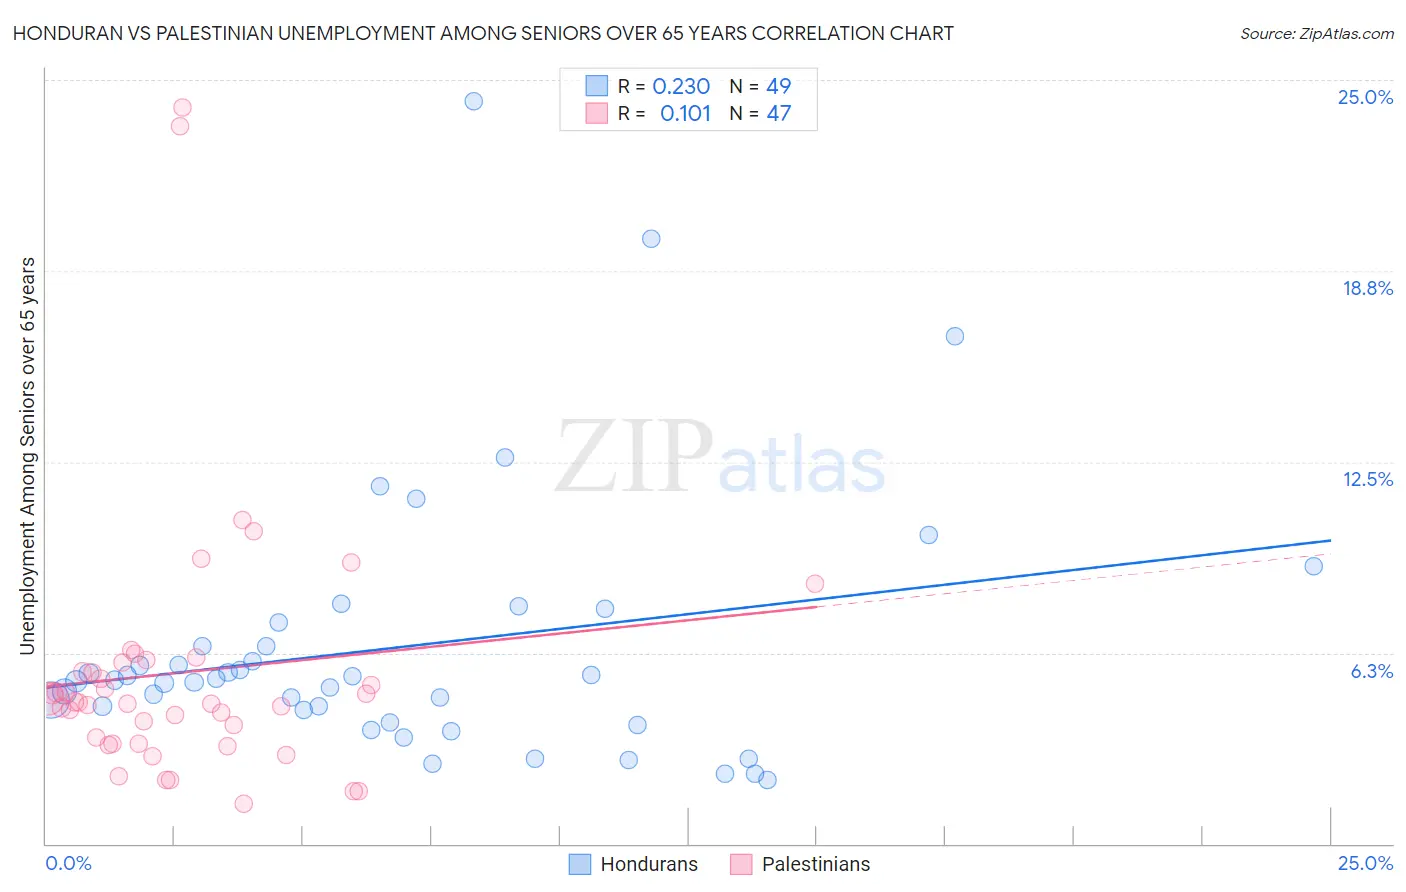
Honduran vs Palestinian Unemployment Among Seniors over 65 years Correlation Chart
The statistical analysis conducted on geographies consisting of 325,799,576 people shows a weak positive correlation between the proportion of Hondurans and unemployment rate amomg seniors over the age of 65 in the United States with a correlation coefficient (R) of 0.230 and weighted average of 5.3%. Similarly, the statistical analysis conducted on geographies consisting of 205,968,161 people shows a poor positive correlation between the proportion of Palestinians and unemployment rate amomg seniors over the age of 65 in the United States with a correlation coefficient (R) of 0.101 and weighted average of 4.8%, a difference of 9.4%.
Unemployment Among Seniors over 65 years Correlation Summary
| Measurement | Honduran | Palestinian |
| Minimum | 2.1% | 1.3% |
| Maximum | 24.3% | 24.1% |
| Range | 22.2% | 22.8% |
| Mean | 6.4% | 5.6% |
| Median | 5.4% | 4.6% |
| Interquartile 25% (IQ1) | 4.2% | 3.3% |
| Interquartile 75% (IQ3) | 6.9% | 5.9% |
| Interquartile Range (IQR) | 2.7% | 2.7% |
| Standard Deviation (Sample) | 4.3% | 4.4% |
| Standard Deviation (Population) | 4.3% | 4.4% |
Similar Demographics by Unemployment Among Seniors over 65 years
Demographics Similar to Hondurans by Unemployment Among Seniors over 65 years
In terms of unemployment among seniors over 65 years, the demographic groups most similar to Hondurans are Immigrants from Syria (5.3%, a difference of 0.010%), Cree (5.3%, a difference of 0.030%), Immigrants from Croatia (5.3%, a difference of 0.050%), French American Indian (5.3%, a difference of 0.060%), and Israeli (5.3%, a difference of 0.090%).
| Demographics | Rating | Rank | Unemployment Among Seniors over 65 years |
| Spaniards | 7.4 /100 | #218 | Tragic 5.2% |
| Dutch West Indians | 6.9 /100 | #219 | Tragic 5.3% |
| Egyptians | 6.4 /100 | #220 | Tragic 5.3% |
| Arapaho | 6.3 /100 | #221 | Tragic 5.3% |
| Israelis | 6.2 /100 | #222 | Tragic 5.3% |
| Cree | 5.8 /100 | #223 | Tragic 5.3% |
| Immigrants | Syria | 5.6 /100 | #224 | Tragic 5.3% |
| Hondurans | 5.6 /100 | #225 | Tragic 5.3% |
| Immigrants | Croatia | 5.3 /100 | #226 | Tragic 5.3% |
| French American Indians | 5.2 /100 | #227 | Tragic 5.3% |
| Haitians | 4.4 /100 | #228 | Tragic 5.3% |
| Samoans | 4.2 /100 | #229 | Tragic 5.3% |
| Immigrants | Argentina | 4.0 /100 | #230 | Tragic 5.3% |
| Hungarians | 3.9 /100 | #231 | Tragic 5.3% |
| Hopi | 3.5 /100 | #232 | Tragic 5.3% |
Demographics Similar to Palestinians by Unemployment Among Seniors over 65 years
In terms of unemployment among seniors over 65 years, the demographic groups most similar to Palestinians are Immigrants from Uganda (4.8%, a difference of 0.090%), Slovene (4.8%, a difference of 0.090%), Belgian (4.8%, a difference of 0.30%), Bhutanese (4.8%, a difference of 0.34%), and Immigrants from Kuwait (4.8%, a difference of 0.36%).
| Demographics | Rating | Rank | Unemployment Among Seniors over 65 years |
| Immigrants | Lebanon | 100.0 /100 | #26 | Exceptional 4.8% |
| Houma | 100.0 /100 | #27 | Exceptional 4.8% |
| Ugandans | 100.0 /100 | #28 | Exceptional 4.8% |
| Immigrants | North Macedonia | 100.0 /100 | #29 | Exceptional 4.8% |
| Belgians | 100.0 /100 | #30 | Exceptional 4.8% |
| Immigrants | Uganda | 100.0 /100 | #31 | Exceptional 4.8% |
| Slovenes | 100.0 /100 | #32 | Exceptional 4.8% |
| Palestinians | 100.0 /100 | #33 | Exceptional 4.8% |
| Bhutanese | 100.0 /100 | #34 | Exceptional 4.8% |
| Immigrants | Kuwait | 100.0 /100 | #35 | Exceptional 4.8% |
| Cambodians | 100.0 /100 | #36 | Exceptional 4.8% |
| Bulgarians | 99.9 /100 | #37 | Exceptional 4.8% |
| Immigrants | India | 99.9 /100 | #38 | Exceptional 4.8% |
| Macedonians | 99.9 /100 | #39 | Exceptional 4.8% |
| Immigrants | Sweden | 99.9 /100 | #40 | Exceptional 4.8% |