Honduran vs Immigrants from Belize Male Unemployment
COMPARE
Honduran
Immigrants from Belize
Male Unemployment
Male Unemployment Comparison
Hondurans
Immigrants from Belize
5.6%
MALE UNEMPLOYMENT
1.1/ 100
METRIC RATING
237th/ 347
METRIC RANK
6.6%
MALE UNEMPLOYMENT
0.0/ 100
METRIC RATING
301st/ 347
METRIC RANK
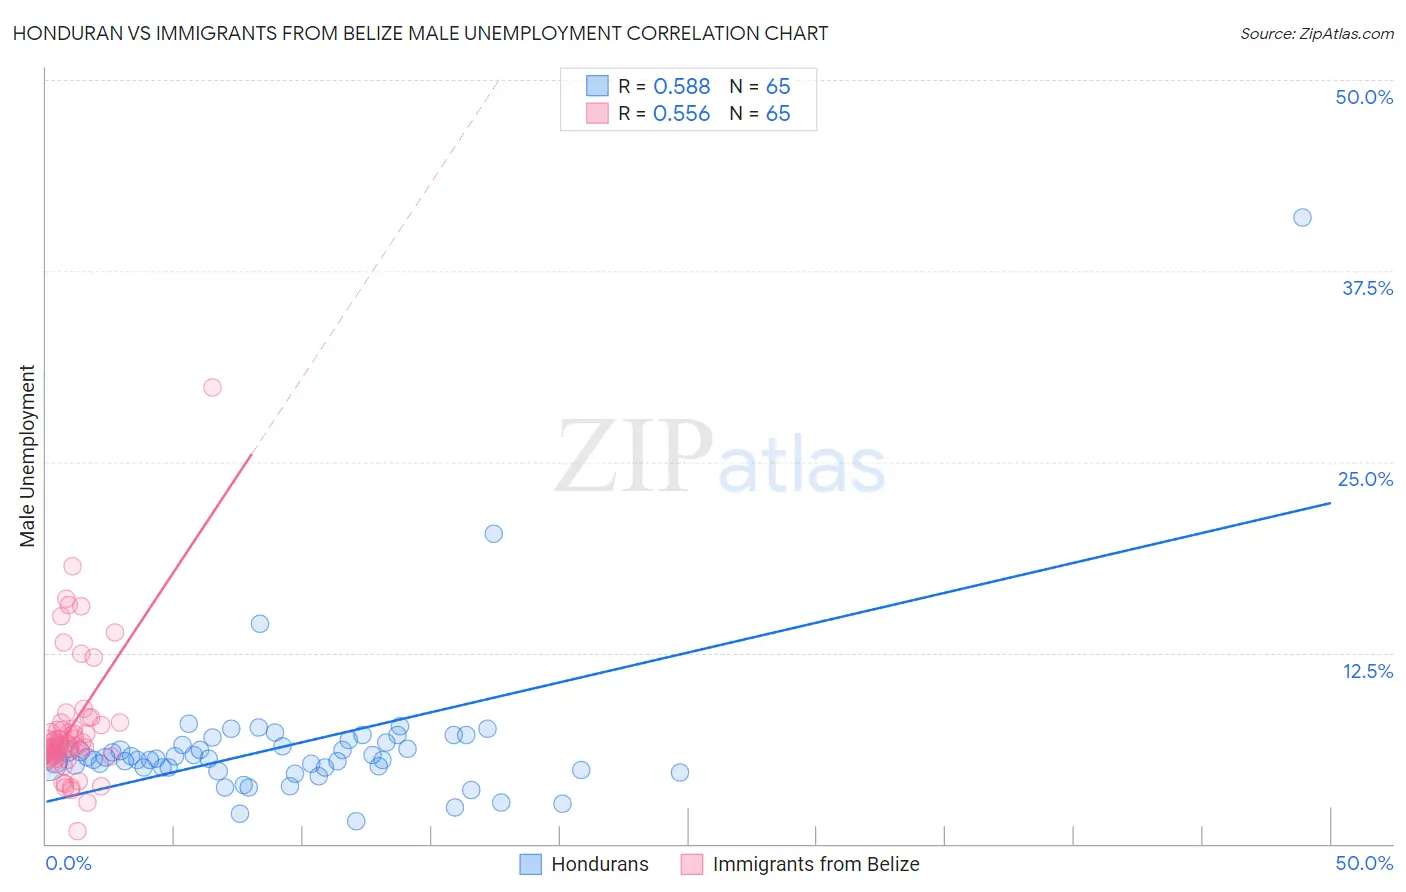
Honduran vs Immigrants from Belize Male Unemployment Correlation Chart
The statistical analysis conducted on geographies consisting of 356,702,099 people shows a substantial positive correlation between the proportion of Hondurans and unemployment rate among males in the United States with a correlation coefficient (R) of 0.588 and weighted average of 5.6%. Similarly, the statistical analysis conducted on geographies consisting of 130,217,625 people shows a substantial positive correlation between the proportion of Immigrants from Belize and unemployment rate among males in the United States with a correlation coefficient (R) of 0.556 and weighted average of 6.6%, a difference of 16.8%.
Male Unemployment Correlation Summary
| Measurement | Honduran | Immigrants from Belize |
| Minimum | 1.5% | 0.80% |
| Maximum | 41.0% | 29.9% |
| Range | 39.5% | 29.1% |
| Mean | 6.4% | 7.7% |
| Median | 5.5% | 6.5% |
| Interquartile 25% (IQ1) | 5.0% | 5.7% |
| Interquartile 75% (IQ3) | 6.6% | 7.9% |
| Interquartile Range (IQR) | 1.6% | 2.1% |
| Standard Deviation (Sample) | 5.0% | 4.4% |
| Standard Deviation (Population) | 5.0% | 4.3% |
Similar Demographics by Male Unemployment
Demographics Similar to Hondurans by Male Unemployment
In terms of male unemployment, the demographic groups most similar to Hondurans are Native Hawaiian (5.6%, a difference of 0.050%), Immigrants from Guatemala (5.6%, a difference of 0.050%), Guatemalan (5.6%, a difference of 0.090%), Immigrants from Cameroon (5.6%, a difference of 0.12%), and Salvadoran (5.7%, a difference of 0.16%).
| Demographics | Rating | Rank | Male Unemployment |
| Immigrants | Africa | 1.7 /100 | #230 | Tragic 5.6% |
| Choctaw | 1.6 /100 | #231 | Tragic 5.6% |
| Moroccans | 1.6 /100 | #232 | Tragic 5.6% |
| Somalis | 1.5 /100 | #233 | Tragic 5.6% |
| Immigrants | Somalia | 1.5 /100 | #234 | Tragic 5.6% |
| Immigrants | Honduras | 1.5 /100 | #235 | Tragic 5.6% |
| Guatemalans | 1.2 /100 | #236 | Tragic 5.6% |
| Hondurans | 1.1 /100 | #237 | Tragic 5.6% |
| Native Hawaiians | 1.1 /100 | #238 | Tragic 5.6% |
| Immigrants | Guatemala | 1.1 /100 | #239 | Tragic 5.6% |
| Immigrants | Cameroon | 1.0 /100 | #240 | Tragic 5.6% |
| Salvadorans | 1.0 /100 | #241 | Tragic 5.7% |
| Ottawa | 0.9 /100 | #242 | Tragic 5.7% |
| Bangladeshis | 0.8 /100 | #243 | Tragic 5.7% |
| Immigrants | El Salvador | 0.7 /100 | #244 | Tragic 5.7% |
Demographics Similar to Immigrants from Belize by Male Unemployment
In terms of male unemployment, the demographic groups most similar to Immigrants from Belize are Vietnamese (6.6%, a difference of 0.11%), Immigrants from Bangladesh (6.6%, a difference of 0.38%), Jamaican (6.6%, a difference of 0.51%), Chippewa (6.6%, a difference of 0.58%), and Ute (6.6%, a difference of 0.71%).
| Demographics | Rating | Rank | Male Unemployment |
| Senegalese | 0.0 /100 | #294 | Tragic 6.4% |
| Belizeans | 0.0 /100 | #295 | Tragic 6.5% |
| Immigrants | Haiti | 0.0 /100 | #296 | Tragic 6.5% |
| Chippewa | 0.0 /100 | #297 | Tragic 6.6% |
| Jamaicans | 0.0 /100 | #298 | Tragic 6.6% |
| Immigrants | Bangladesh | 0.0 /100 | #299 | Tragic 6.6% |
| Vietnamese | 0.0 /100 | #300 | Tragic 6.6% |
| Immigrants | Belize | 0.0 /100 | #301 | Tragic 6.6% |
| Ute | 0.0 /100 | #302 | Tragic 6.6% |
| Immigrants | West Indies | 0.0 /100 | #303 | Tragic 6.7% |
| West Indians | 0.0 /100 | #304 | Tragic 6.7% |
| Trinidadians and Tobagonians | 0.0 /100 | #305 | Tragic 6.7% |
| Immigrants | Trinidad and Tobago | 0.0 /100 | #306 | Tragic 6.7% |
| Immigrants | Jamaica | 0.0 /100 | #307 | Tragic 6.7% |
| Aleuts | 0.0 /100 | #308 | Tragic 6.8% |