Hmong vs Immigrants from Saudi Arabia Unemployment Among Youth under 25 years
COMPARE
Hmong
Immigrants from Saudi Arabia
Unemployment Among Youth under 25 years
Unemployment Among Youth under 25 years Comparison
Hmong
Immigrants from Saudi Arabia
10.8%
UNEMPLOYMENT AMONG YOUTH UNDER 25 YEARS
99.8/ 100
METRIC RATING
36th/ 347
METRIC RANK
11.1%
UNEMPLOYMENT AMONG YOUTH UNDER 25 YEARS
98.8/ 100
METRIC RATING
56th/ 347
METRIC RANK
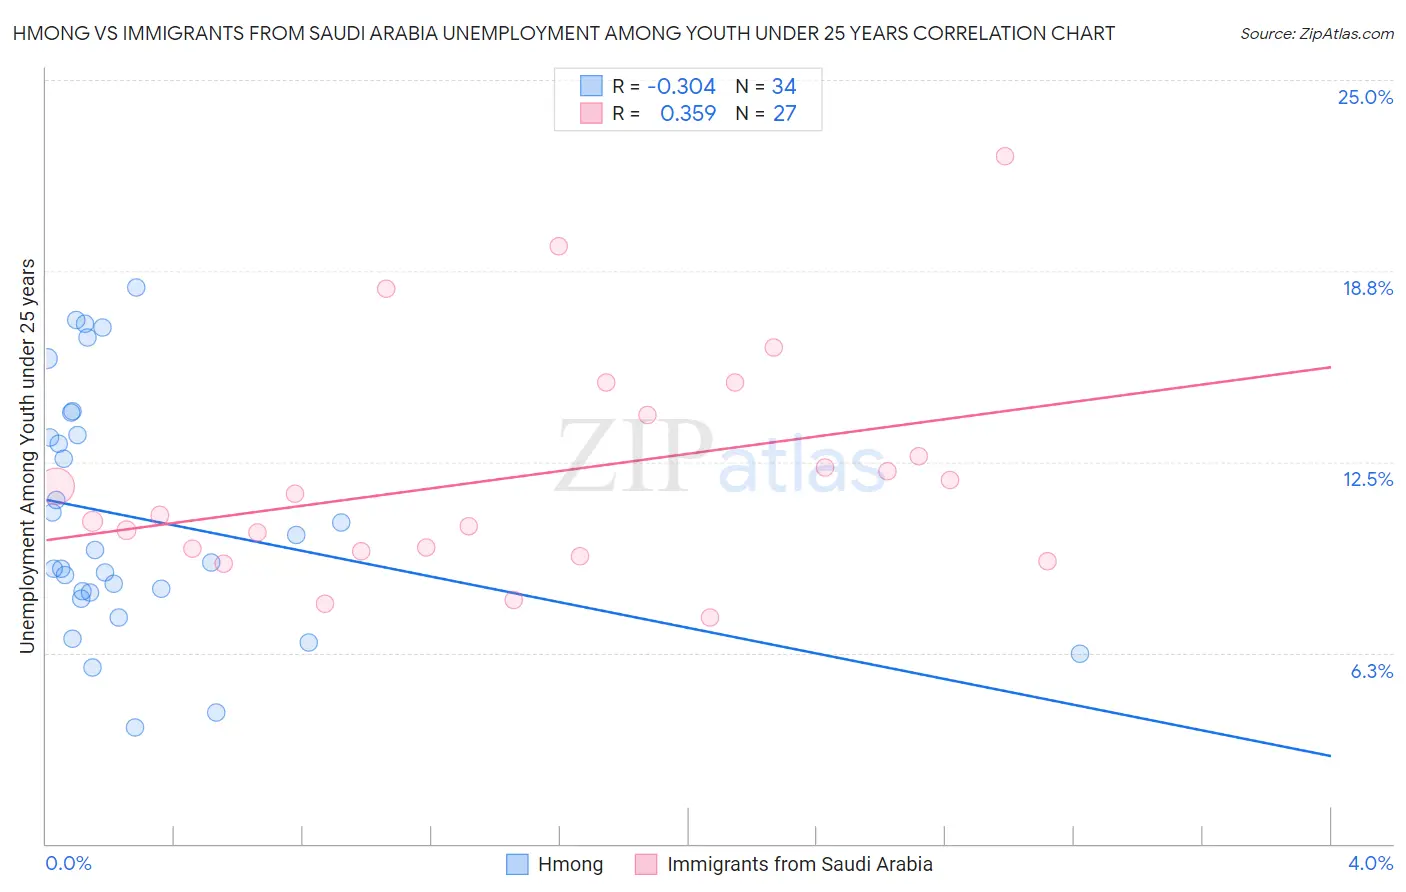
Hmong vs Immigrants from Saudi Arabia Unemployment Among Youth under 25 years Correlation Chart
The statistical analysis conducted on geographies consisting of 24,654,180 people shows a mild negative correlation between the proportion of Hmong and unemployment rate among youth under the age of 25 in the United States with a correlation coefficient (R) of -0.304 and weighted average of 10.8%. Similarly, the statistical analysis conducted on geographies consisting of 163,954,627 people shows a mild positive correlation between the proportion of Immigrants from Saudi Arabia and unemployment rate among youth under the age of 25 in the United States with a correlation coefficient (R) of 0.359 and weighted average of 11.1%, a difference of 2.2%.
Unemployment Among Youth under 25 years Correlation Summary
| Measurement | Hmong | Immigrants from Saudi Arabia |
| Minimum | 3.8% | 7.4% |
| Maximum | 18.2% | 22.5% |
| Range | 14.4% | 15.1% |
| Mean | 10.6% | 12.0% |
| Median | 9.4% | 10.7% |
| Interquartile 25% (IQ1) | 8.2% | 9.6% |
| Interquartile 75% (IQ3) | 13.4% | 14.0% |
| Interquartile Range (IQR) | 5.2% | 4.5% |
| Standard Deviation (Sample) | 3.9% | 3.7% |
| Standard Deviation (Population) | 3.9% | 3.6% |
Demographics Similar to Hmong and Immigrants from Saudi Arabia by Unemployment Among Youth under 25 years
In terms of unemployment among youth under 25 years, the demographic groups most similar to Hmong are Immigrants from Zimbabwe (10.8%, a difference of 0.15%), Immigrants from Congo (10.9%, a difference of 0.23%), Immigrants from Zaire (10.9%, a difference of 0.24%), Scottish (10.9%, a difference of 0.40%), and Croatian (10.9%, a difference of 0.49%). Similarly, the demographic groups most similar to Immigrants from Saudi Arabia are Mongolian (11.1%, a difference of 0.020%), Irish (11.1%, a difference of 0.020%), Ottawa (11.1%, a difference of 0.11%), Latvian (11.0%, a difference of 0.20%), and Serbian (11.0%, a difference of 0.21%).
| Demographics | Rating | Rank | Unemployment Among Youth under 25 years |
| Hmong | 99.8 /100 | #36 | Exceptional 10.8% |
| Immigrants | Zimbabwe | 99.8 /100 | #37 | Exceptional 10.8% |
| Immigrants | Congo | 99.8 /100 | #38 | Exceptional 10.9% |
| Immigrants | Zaire | 99.8 /100 | #39 | Exceptional 10.9% |
| Scottish | 99.8 /100 | #40 | Exceptional 10.9% |
| Croatians | 99.8 /100 | #41 | Exceptional 10.9% |
| Cambodians | 99.7 /100 | #42 | Exceptional 10.9% |
| British | 99.7 /100 | #43 | Exceptional 10.9% |
| Welsh | 99.7 /100 | #44 | Exceptional 10.9% |
| Bulgarians | 99.6 /100 | #45 | Exceptional 10.9% |
| Tongans | 99.6 /100 | #46 | Exceptional 10.9% |
| Australians | 99.6 /100 | #47 | Exceptional 10.9% |
| Poles | 99.3 /100 | #48 | Exceptional 11.0% |
| Thais | 99.3 /100 | #49 | Exceptional 11.0% |
| Czechoslovakians | 99.2 /100 | #50 | Exceptional 11.0% |
| Serbians | 99.0 /100 | #51 | Exceptional 11.0% |
| Latvians | 99.0 /100 | #52 | Exceptional 11.0% |
| Ottawa | 99.0 /100 | #53 | Exceptional 11.1% |
| Mongolians | 98.9 /100 | #54 | Exceptional 11.1% |
| Irish | 98.9 /100 | #55 | Exceptional 11.1% |
| Immigrants | Saudi Arabia | 98.8 /100 | #56 | Exceptional 11.1% |