Hispanic or Latino vs Immigrants from Belize Unemployment Among Seniors over 65 years
COMPARE
Hispanic or Latino
Immigrants from Belize
Unemployment Among Seniors over 65 years
Unemployment Among Seniors over 65 years Comparison
Hispanics or Latinos
Immigrants from Belize
5.6%
UNEMPLOYMENT AMONG SENIORS OVER 65 YEARS
0.0/ 100
METRIC RATING
301st/ 347
METRIC RANK
5.5%
UNEMPLOYMENT AMONG SENIORS OVER 65 YEARS
0.0/ 100
METRIC RATING
282nd/ 347
METRIC RANK
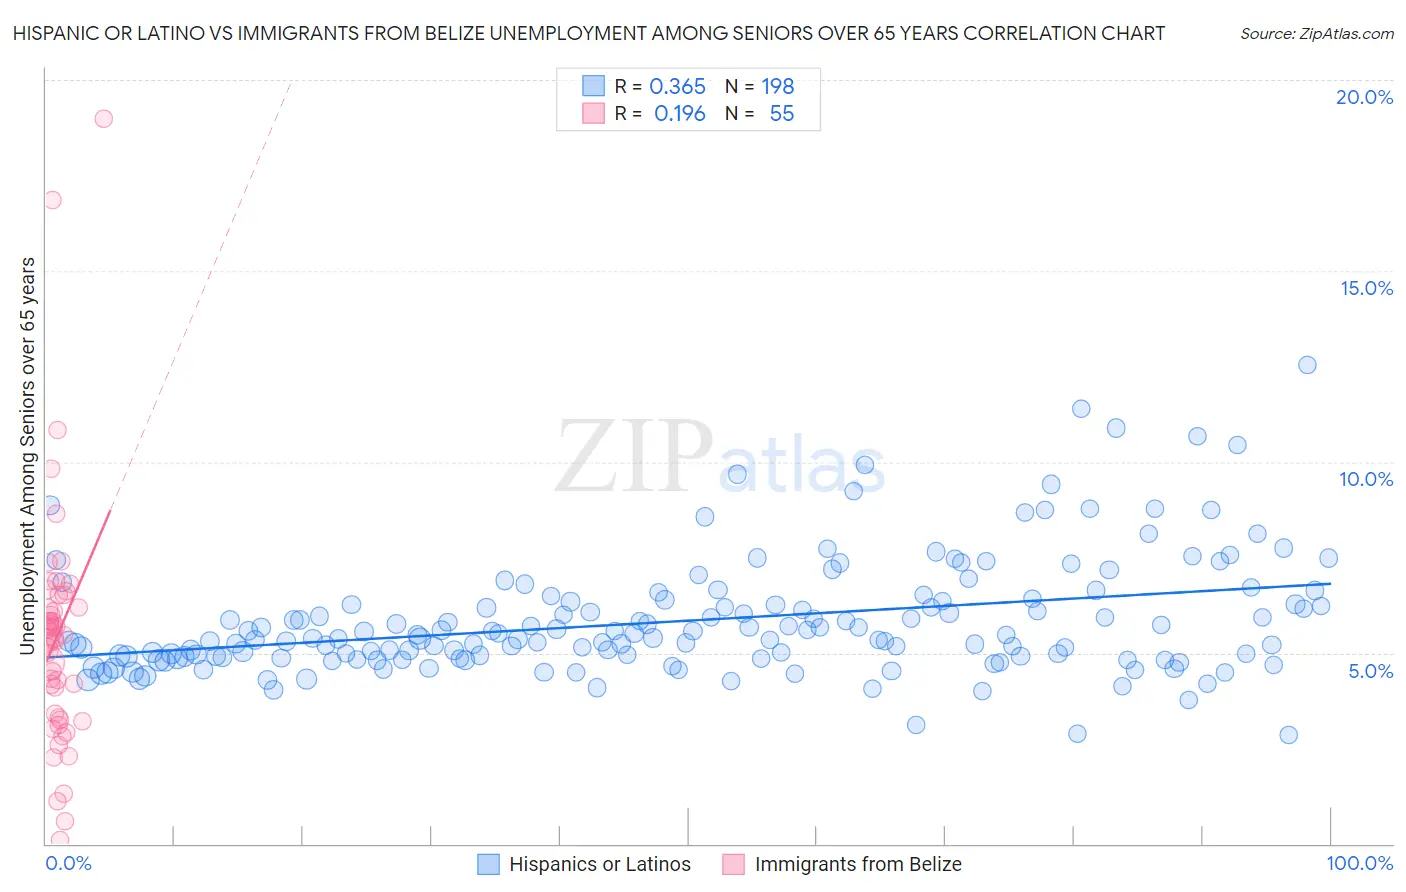
Hispanic or Latino vs Immigrants from Belize Unemployment Among Seniors over 65 years Correlation Chart
The statistical analysis conducted on geographies consisting of 464,313,086 people shows a mild positive correlation between the proportion of Hispanics or Latinos and unemployment rate amomg seniors over the age of 65 in the United States with a correlation coefficient (R) of 0.365 and weighted average of 5.6%. Similarly, the statistical analysis conducted on geographies consisting of 125,826,150 people shows a poor positive correlation between the proportion of Immigrants from Belize and unemployment rate amomg seniors over the age of 65 in the United States with a correlation coefficient (R) of 0.196 and weighted average of 5.5%, a difference of 1.9%.
Unemployment Among Seniors over 65 years Correlation Summary
| Measurement | Hispanic or Latino | Immigrants from Belize |
| Minimum | 2.8% | 0.10% |
| Maximum | 12.5% | 19.0% |
| Range | 9.7% | 18.9% |
| Mean | 5.8% | 5.5% |
| Median | 5.4% | 5.5% |
| Interquartile 25% (IQ1) | 4.9% | 3.3% |
| Interquartile 75% (IQ3) | 6.3% | 6.5% |
| Interquartile Range (IQR) | 1.5% | 3.2% |
| Standard Deviation (Sample) | 1.5% | 3.2% |
| Standard Deviation (Population) | 1.5% | 3.2% |
Demographics Similar to Hispanics or Latinos and Immigrants from Belize by Unemployment Among Seniors over 65 years
In terms of unemployment among seniors over 65 years, the demographic groups most similar to Hispanics or Latinos are Zimbabwean (5.6%, a difference of 0.20%), Guyanese (5.6%, a difference of 0.26%), Immigrants from West Indies (5.6%, a difference of 0.34%), Yaqui (5.5%, a difference of 0.46%), and Cape Verdean (5.5%, a difference of 0.47%). Similarly, the demographic groups most similar to Immigrants from Belize are Immigrants from Norway (5.5%, a difference of 0.13%), Immigrants from Haiti (5.5%, a difference of 0.19%), Immigrants from Liberia (5.5%, a difference of 0.50%), Central American (5.5%, a difference of 0.56%), and Immigrants from Barbados (5.5%, a difference of 0.59%).
| Demographics | Rating | Rank | Unemployment Among Seniors over 65 years |
| Immigrants | Norway | 0.0 /100 | #281 | Tragic 5.5% |
| Immigrants | Belize | 0.0 /100 | #282 | Tragic 5.5% |
| Immigrants | Haiti | 0.0 /100 | #283 | Tragic 5.5% |
| Immigrants | Liberia | 0.0 /100 | #284 | Tragic 5.5% |
| Central Americans | 0.0 /100 | #285 | Tragic 5.5% |
| Immigrants | Barbados | 0.0 /100 | #286 | Tragic 5.5% |
| Venezuelans | 0.0 /100 | #287 | Tragic 5.5% |
| U.S. Virgin Islanders | 0.0 /100 | #288 | Tragic 5.5% |
| Immigrants | Cabo Verde | 0.0 /100 | #289 | Tragic 5.5% |
| Jamaicans | 0.0 /100 | #290 | Tragic 5.5% |
| Blacks/African Americans | 0.0 /100 | #291 | Tragic 5.5% |
| Belizeans | 0.0 /100 | #292 | Tragic 5.5% |
| Immigrants | Venezuela | 0.0 /100 | #293 | Tragic 5.5% |
| Armenians | 0.0 /100 | #294 | Tragic 5.5% |
| Cheyenne | 0.0 /100 | #295 | Tragic 5.5% |
| Cape Verdeans | 0.0 /100 | #296 | Tragic 5.5% |
| Yaqui | 0.0 /100 | #297 | Tragic 5.5% |
| Immigrants | West Indies | 0.0 /100 | #298 | Tragic 5.6% |
| Guyanese | 0.0 /100 | #299 | Tragic 5.6% |
| Zimbabweans | 0.0 /100 | #300 | Tragic 5.6% |
| Hispanics or Latinos | 0.0 /100 | #301 | Tragic 5.6% |