Hawaiian vs Assyrian/Chaldean/Syriac Unemployment Among Ages 60 to 64 years
COMPARE
Hawaiian
Assyrian/Chaldean/Syriac
Unemployment Among Ages 60 to 64 years
Unemployment Among Ages 60 to 64 years Comparison
Hawaiians
Assyrians/Chaldeans/Syriacs
4.6%
UNEMPLOYMENT AMONG AGES 60 TO 64 YEARS
99.6/ 100
METRIC RATING
66th/ 347
METRIC RANK
4.5%
UNEMPLOYMENT AMONG AGES 60 TO 64 YEARS
99.9/ 100
METRIC RATING
47th/ 347
METRIC RANK
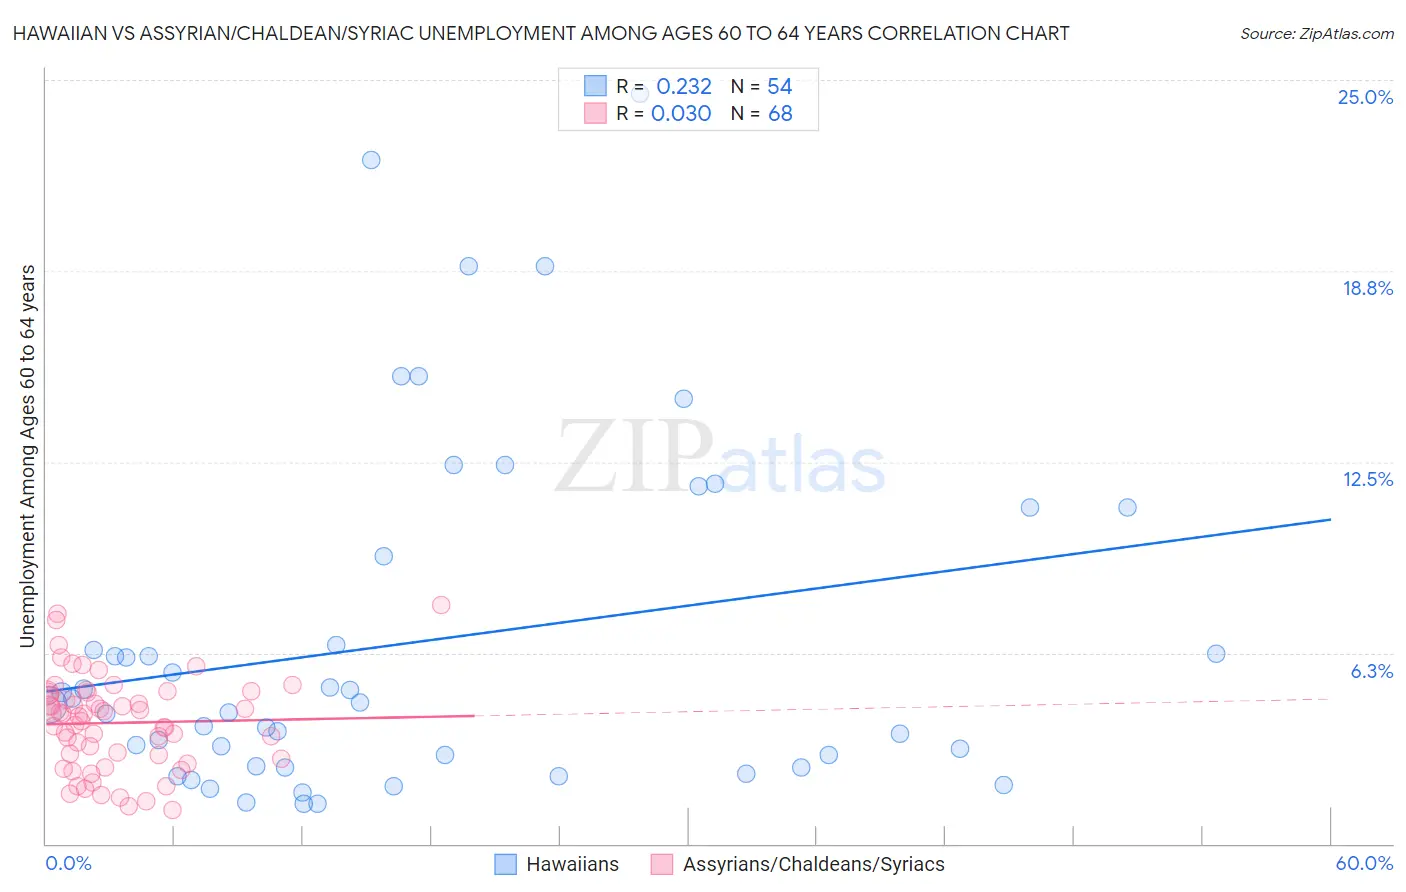
Hawaiian vs Assyrian/Chaldean/Syriac Unemployment Among Ages 60 to 64 years Correlation Chart
The statistical analysis conducted on geographies consisting of 299,146,870 people shows a weak positive correlation between the proportion of Hawaiians and unemployment rate among population between the ages 60 and 64 in the United States with a correlation coefficient (R) of 0.232 and weighted average of 4.6%. Similarly, the statistical analysis conducted on geographies consisting of 107,458,902 people shows no correlation between the proportion of Assyrians/Chaldeans/Syriacs and unemployment rate among population between the ages 60 and 64 in the United States with a correlation coefficient (R) of 0.030 and weighted average of 4.5%, a difference of 1.6%.
Unemployment Among Ages 60 to 64 years Correlation Summary
| Measurement | Hawaiian | Assyrian/Chaldean/Syriac |
| Minimum | 1.3% | 1.1% |
| Maximum | 24.6% | 7.8% |
| Range | 23.3% | 6.7% |
| Mean | 6.6% | 4.0% |
| Median | 4.6% | 4.2% |
| Interquartile 25% (IQ1) | 2.5% | 2.9% |
| Interquartile 75% (IQ3) | 9.4% | 4.9% |
| Interquartile Range (IQR) | 6.9% | 2.1% |
| Standard Deviation (Sample) | 5.7% | 1.5% |
| Standard Deviation (Population) | 5.6% | 1.5% |
Demographics Similar to Hawaiians and Assyrians/Chaldeans/Syriacs by Unemployment Among Ages 60 to 64 years
In terms of unemployment among ages 60 to 64 years, the demographic groups most similar to Hawaiians are Jordanian (4.6%, a difference of 0.20%), Immigrants from Middle Africa (4.6%, a difference of 0.23%), Czechoslovakian (4.6%, a difference of 0.24%), Senegalese (4.6%, a difference of 0.27%), and Lebanese (4.6%, a difference of 0.37%). Similarly, the demographic groups most similar to Assyrians/Chaldeans/Syriacs are Bhutanese (4.5%, a difference of 0.19%), Immigrants from Zimbabwe (4.6%, a difference of 0.22%), Scotch-Irish (4.6%, a difference of 0.27%), Scottish (4.6%, a difference of 0.30%), and Immigrants from Kenya (4.6%, a difference of 0.42%).
| Demographics | Rating | Rank | Unemployment Among Ages 60 to 64 years |
| Bhutanese | 99.9 /100 | #46 | Exceptional 4.5% |
| Assyrians/Chaldeans/Syriacs | 99.9 /100 | #47 | Exceptional 4.5% |
| Immigrants | Zimbabwe | 99.9 /100 | #48 | Exceptional 4.6% |
| Scotch-Irish | 99.9 /100 | #49 | Exceptional 4.6% |
| Scottish | 99.9 /100 | #50 | Exceptional 4.6% |
| Immigrants | Kenya | 99.9 /100 | #51 | Exceptional 4.6% |
| Kenyans | 99.9 /100 | #52 | Exceptional 4.6% |
| Immigrants | Moldova | 99.9 /100 | #53 | Exceptional 4.6% |
| Dutch | 99.9 /100 | #54 | Exceptional 4.6% |
| Bangladeshis | 99.9 /100 | #55 | Exceptional 4.6% |
| Welsh | 99.9 /100 | #56 | Exceptional 4.6% |
| British | 99.9 /100 | #57 | Exceptional 4.6% |
| Immigrants | India | 99.8 /100 | #58 | Exceptional 4.6% |
| Swiss | 99.8 /100 | #59 | Exceptional 4.6% |
| Puget Sound Salish | 99.8 /100 | #60 | Exceptional 4.6% |
| Lebanese | 99.8 /100 | #61 | Exceptional 4.6% |
| Senegalese | 99.7 /100 | #62 | Exceptional 4.6% |
| Czechoslovakians | 99.7 /100 | #63 | Exceptional 4.6% |
| Immigrants | Middle Africa | 99.7 /100 | #64 | Exceptional 4.6% |
| Jordanians | 99.7 /100 | #65 | Exceptional 4.6% |
| Hawaiians | 99.6 /100 | #66 | Exceptional 4.6% |