Guyanese vs Immigrants from Moldova Unemployment Among Youth under 25 years
COMPARE
Guyanese
Immigrants from Moldova
Unemployment Among Youth under 25 years
Unemployment Among Youth under 25 years Comparison
Guyanese
Immigrants from Moldova
15.9%
UNEMPLOYMENT AMONG YOUTH UNDER 25 YEARS
0.0/ 100
METRIC RATING
333rd/ 347
METRIC RANK
11.2%
UNEMPLOYMENT AMONG YOUTH UNDER 25 YEARS
97.5/ 100
METRIC RATING
69th/ 347
METRIC RANK
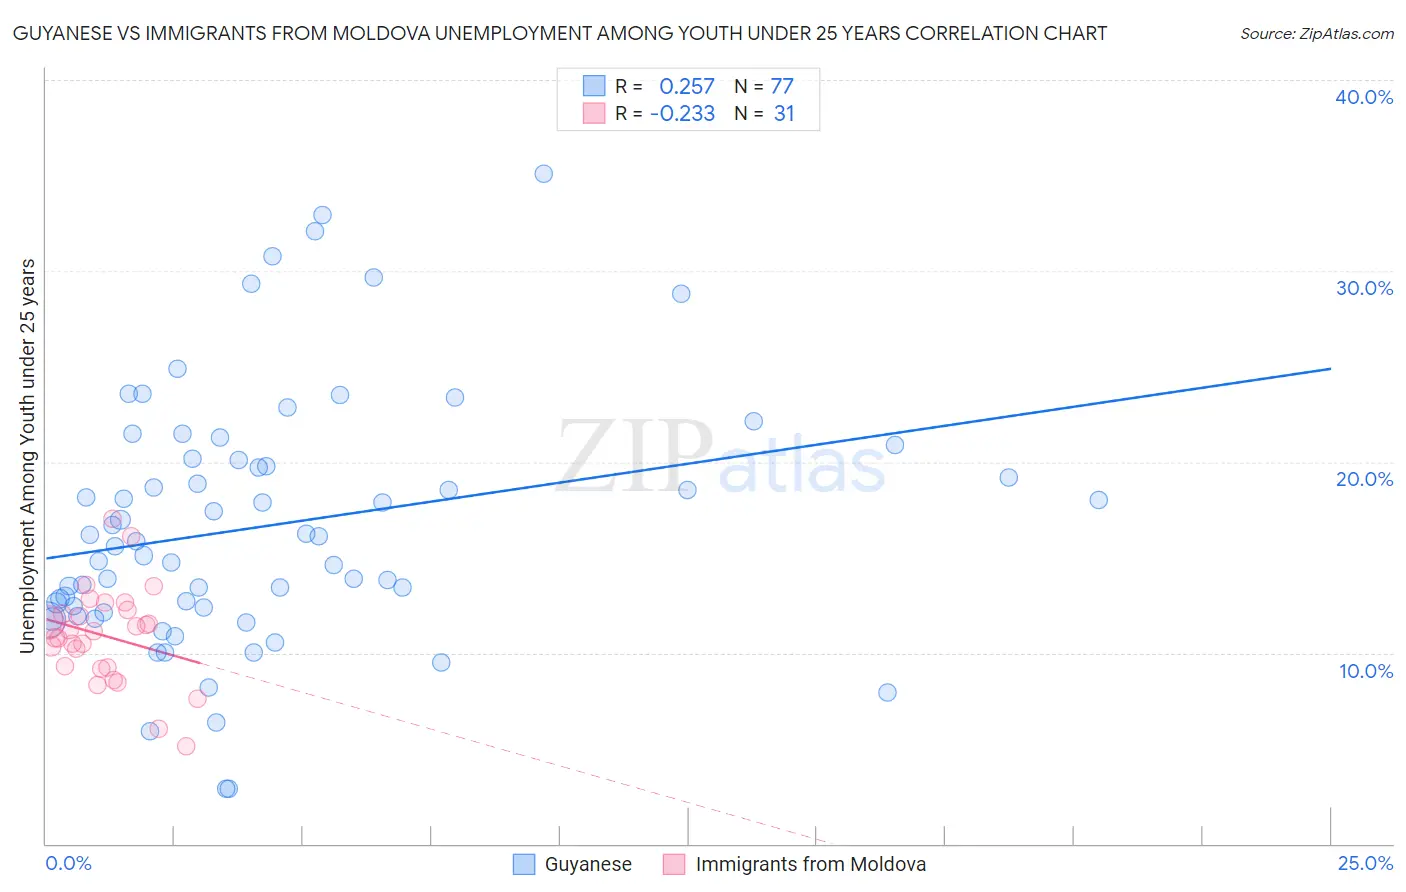
Guyanese vs Immigrants from Moldova Unemployment Among Youth under 25 years Correlation Chart
The statistical analysis conducted on geographies consisting of 176,229,123 people shows a weak positive correlation between the proportion of Guyanese and unemployment rate among youth under the age of 25 in the United States with a correlation coefficient (R) of 0.257 and weighted average of 15.9%. Similarly, the statistical analysis conducted on geographies consisting of 123,926,659 people shows a weak negative correlation between the proportion of Immigrants from Moldova and unemployment rate among youth under the age of 25 in the United States with a correlation coefficient (R) of -0.233 and weighted average of 11.2%, a difference of 42.3%.
Unemployment Among Youth under 25 years Correlation Summary
| Measurement | Guyanese | Immigrants from Moldova |
| Minimum | 2.9% | 5.1% |
| Maximum | 35.1% | 17.0% |
| Range | 32.2% | 11.9% |
| Mean | 16.7% | 10.9% |
| Median | 15.9% | 11.1% |
| Interquartile 25% (IQ1) | 12.3% | 9.2% |
| Interquartile 75% (IQ3) | 20.2% | 12.2% |
| Interquartile Range (IQR) | 7.9% | 3.0% |
| Standard Deviation (Sample) | 6.7% | 2.5% |
| Standard Deviation (Population) | 6.6% | 2.5% |
Similar Demographics by Unemployment Among Youth under 25 years
Demographics Similar to Guyanese by Unemployment Among Youth under 25 years
In terms of unemployment among youth under 25 years, the demographic groups most similar to Guyanese are Immigrants from Guyana (15.9%, a difference of 0.25%), Immigrants from Grenada (15.8%, a difference of 0.46%), Dominican (15.7%, a difference of 1.1%), Immigrants from St. Vincent and the Grenadines (16.1%, a difference of 1.6%), and Yakama (15.6%, a difference of 2.0%).
| Demographics | Rating | Rank | Unemployment Among Youth under 25 years |
| Immigrants | Barbados | 0.0 /100 | #326 | Tragic 15.2% |
| British West Indians | 0.0 /100 | #327 | Tragic 15.5% |
| Immigrants | Dominican Republic | 0.0 /100 | #328 | Tragic 15.6% |
| Immigrants | Yemen | 0.0 /100 | #329 | Tragic 15.6% |
| Yakama | 0.0 /100 | #330 | Tragic 15.6% |
| Dominicans | 0.0 /100 | #331 | Tragic 15.7% |
| Immigrants | Grenada | 0.0 /100 | #332 | Tragic 15.8% |
| Guyanese | 0.0 /100 | #333 | Tragic 15.9% |
| Immigrants | Guyana | 0.0 /100 | #334 | Tragic 15.9% |
| Immigrants | St. Vincent and the Grenadines | 0.0 /100 | #335 | Tragic 16.1% |
| Pima | 0.0 /100 | #336 | Tragic 16.2% |
| Arapaho | 0.0 /100 | #337 | Tragic 16.3% |
| Yuman | 0.0 /100 | #338 | Tragic 16.3% |
| Tsimshian | 0.0 /100 | #339 | Tragic 16.5% |
| Colville | 0.0 /100 | #340 | Tragic 16.8% |
Demographics Similar to Immigrants from Moldova by Unemployment Among Youth under 25 years
In terms of unemployment among youth under 25 years, the demographic groups most similar to Immigrants from Moldova are Slavic (11.2%, a difference of 0.010%), Bhutanese (11.2%, a difference of 0.040%), Immigrants from Kenya (11.2%, a difference of 0.050%), Chickasaw (11.2%, a difference of 0.060%), and Macedonian (11.2%, a difference of 0.080%).
| Demographics | Rating | Rank | Unemployment Among Youth under 25 years |
| Immigrants | Netherlands | 98.1 /100 | #62 | Exceptional 11.1% |
| Immigrants | Croatia | 98.1 /100 | #63 | Exceptional 11.1% |
| Jordanians | 97.9 /100 | #64 | Exceptional 11.1% |
| Immigrants | Singapore | 97.8 /100 | #65 | Exceptional 11.2% |
| Macedonians | 97.7 /100 | #66 | Exceptional 11.2% |
| Chickasaw | 97.7 /100 | #67 | Exceptional 11.2% |
| Immigrants | Kenya | 97.6 /100 | #68 | Exceptional 11.2% |
| Immigrants | Moldova | 97.5 /100 | #69 | Exceptional 11.2% |
| Slavs | 97.5 /100 | #70 | Exceptional 11.2% |
| Bhutanese | 97.4 /100 | #71 | Exceptional 11.2% |
| Immigrants | Australia | 97.3 /100 | #72 | Exceptional 11.2% |
| Creek | 97.2 /100 | #73 | Exceptional 11.2% |
| New Zealanders | 97.2 /100 | #74 | Exceptional 11.2% |
| French | 97.1 /100 | #75 | Exceptional 11.2% |
| German Russians | 97.0 /100 | #76 | Exceptional 11.2% |