Guatemalan vs Immigrants from South America Unemployment Among Seniors over 75 years
COMPARE
Guatemalan
Immigrants from South America
Unemployment Among Seniors over 75 years
Unemployment Among Seniors over 75 years Comparison
Guatemalans
Immigrants from South America
8.8%
UNEMPLOYMENT AMONG SENIORS OVER 75 YEARS
39.5/ 100
METRIC RATING
182nd/ 347
METRIC RANK
8.6%
UNEMPLOYMENT AMONG SENIORS OVER 75 YEARS
71.3/ 100
METRIC RATING
162nd/ 347
METRIC RANK
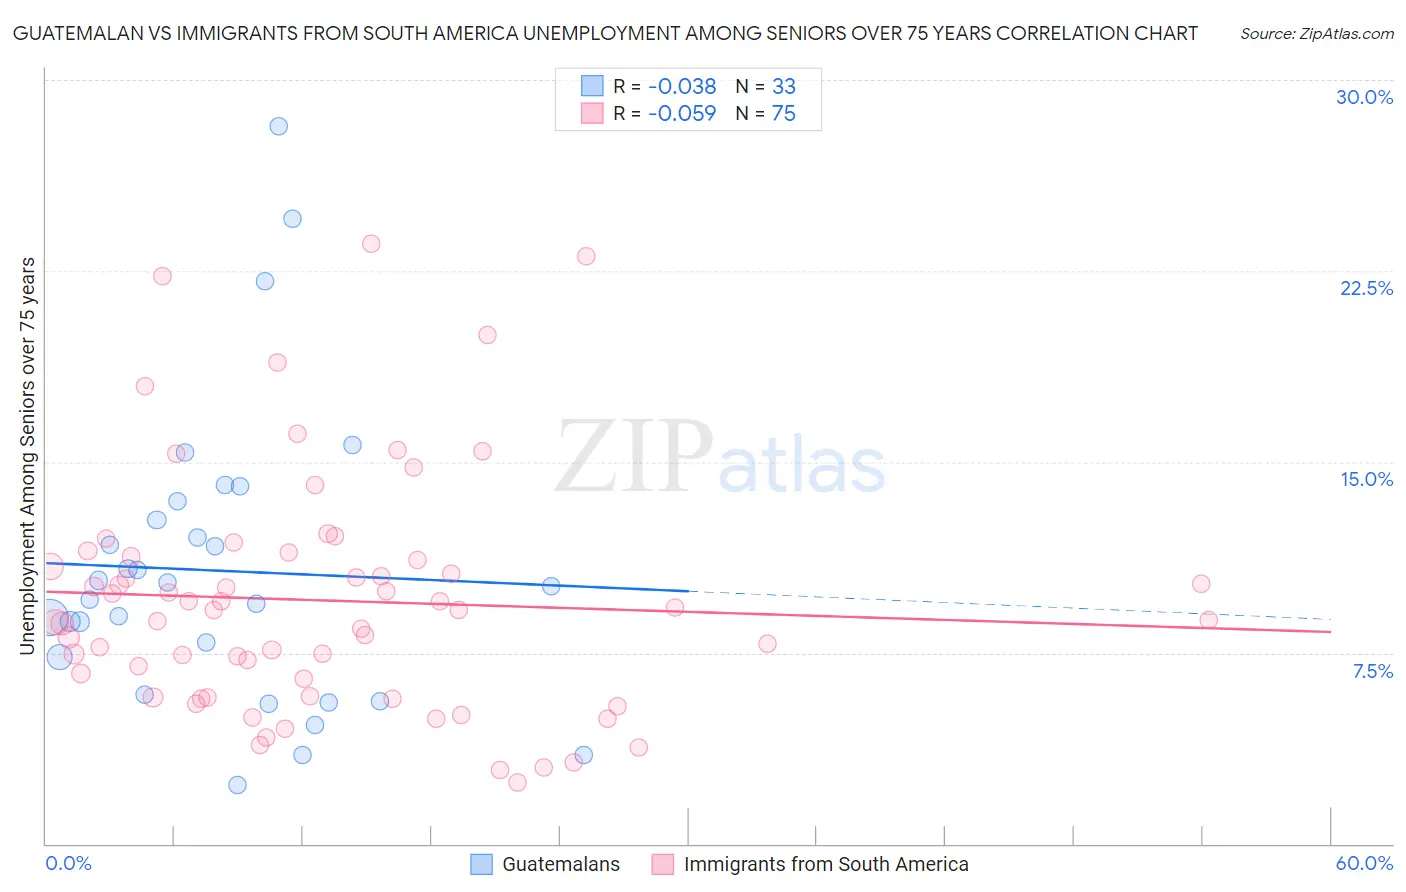
Guatemalan vs Immigrants from South America Unemployment Among Seniors over 75 years Correlation Chart
The statistical analysis conducted on geographies consisting of 204,244,700 people shows no correlation between the proportion of Guatemalans and unemployment rate among seniors over the age of 75 in the United States with a correlation coefficient (R) of -0.038 and weighted average of 8.8%. Similarly, the statistical analysis conducted on geographies consisting of 224,227,019 people shows a slight negative correlation between the proportion of Immigrants from South America and unemployment rate among seniors over the age of 75 in the United States with a correlation coefficient (R) of -0.059 and weighted average of 8.6%, a difference of 1.8%.
Unemployment Among Seniors over 75 years Correlation Summary
| Measurement | Guatemalan | Immigrants from South America |
| Minimum | 2.3% | 2.4% |
| Maximum | 28.2% | 23.6% |
| Range | 25.9% | 21.2% |
| Mean | 10.7% | 9.6% |
| Median | 10.1% | 9.2% |
| Interquartile 25% (IQ1) | 6.6% | 5.8% |
| Interquartile 75% (IQ3) | 13.1% | 11.3% |
| Interquartile Range (IQR) | 6.5% | 5.5% |
| Standard Deviation (Sample) | 5.8% | 4.7% |
| Standard Deviation (Population) | 5.7% | 4.6% |
Demographics Similar to Guatemalans and Immigrants from South America by Unemployment Among Seniors over 75 years
In terms of unemployment among seniors over 75 years, the demographic groups most similar to Guatemalans are Immigrants from Thailand (8.8%, a difference of 0.040%), Immigrants from Italy (8.8%, a difference of 0.12%), Immigrants from Somalia (8.8%, a difference of 0.12%), West Indian (8.8%, a difference of 0.13%), and Central American (8.8%, a difference of 0.21%). Similarly, the demographic groups most similar to Immigrants from South America are Immigrants from Guatemala (8.7%, a difference of 0.19%), Paraguayan (8.7%, a difference of 0.56%), Immigrants from Dominican Republic (8.7%, a difference of 0.60%), Immigrants from Belize (8.7%, a difference of 0.81%), and Immigrants from Eastern Africa (8.7%, a difference of 0.82%).
| Demographics | Rating | Rank | Unemployment Among Seniors over 75 years |
| Immigrants | South America | 71.3 /100 | #162 | Good 8.6% |
| Immigrants | Guatemala | 68.4 /100 | #163 | Good 8.7% |
| Paraguayans | 62.2 /100 | #164 | Good 8.7% |
| Immigrants | Dominican Republic | 61.4 /100 | #165 | Good 8.7% |
| Immigrants | Belize | 57.6 /100 | #166 | Average 8.7% |
| Immigrants | Eastern Africa | 57.6 /100 | #167 | Average 8.7% |
| Immigrants | Lithuania | 57.2 /100 | #168 | Average 8.7% |
| Fijians | 56.4 /100 | #169 | Average 8.7% |
| Zimbabweans | 54.1 /100 | #170 | Average 8.7% |
| Dominicans | 51.9 /100 | #171 | Average 8.7% |
| Immigrants | Immigrants | 51.8 /100 | #172 | Average 8.7% |
| Australians | 50.3 /100 | #173 | Average 8.7% |
| Immigrants | El Salvador | 49.7 /100 | #174 | Average 8.7% |
| Syrians | 49.6 /100 | #175 | Average 8.7% |
| Somalis | 45.3 /100 | #176 | Average 8.8% |
| Central Americans | 43.3 /100 | #177 | Average 8.8% |
| West Indians | 41.9 /100 | #178 | Average 8.8% |
| Immigrants | Italy | 41.7 /100 | #179 | Average 8.8% |
| Immigrants | Somalia | 41.7 /100 | #180 | Average 8.8% |
| Immigrants | Thailand | 40.2 /100 | #181 | Average 8.8% |
| Guatemalans | 39.5 /100 | #182 | Fair 8.8% |