Greek vs Immigrants from Western Africa Unemployment Among Ages 60 to 64 years

COMPARE

Greek
Race
Ancestry
AfghanAfricanAlaska NativeAlaskan AthabascanAlbanianAleutAlsatianAmericanApacheArabArapahoArgentineanArmenianAssyrian/Chaldean/SyriacAustralianAustrianBahamianBangladeshiBarbadianBasqueBelgianBelizeanBermudanBhutaneseBlackfeetBolivianBrazilianBritishBritish West IndianBulgarianBurmeseCajunCambodianCanadianCape VerdeanCarpatho RusynCelticCentral AmericanCentral American IndianCherokeeCheyenneChickasawChileanChineseChippewaChoctawColombianColvilleComancheCosta RicanCreeCreekCroatianCrowCubanCypriotCzechCzechoslovakianDanishDelawareDominicanDutchDutch West IndianEastern EuropeanEcuadorianEgyptianEnglishEstonianEthiopianEuropeanFijianFilipinoFinnishFrenchFrench American IndianFrench CanadianGermanGerman RussianGhanaianGreekGuamanian/ChamorroGuatemalanGuyaneseHaitianHmongHonduranHopiHoumaHungarianIcelanderIndian (Asian)IndonesianInupiatIranianIraqiIrishIroquoisIsraeliItalianJamaicanJapaneseJordanianKenyanKiowaKoreanLaotianLatvianLebaneseLiberianLithuanianLumbeeLuxembourgerMacedonianMalaysianMalteseMarshalleseMenomineeMexicanMexican American IndianMongolianMoroccanNative HawaiianNavajoNepaleseNew ZealanderNicaraguanNigerianNorthern EuropeanNorwegianOkinawanOsageOttawaPaiutePakistaniPalestinianPanamanianParaguayanPennsylvania GermanPeruvianPimaPolishPortuguesePotawatomiPuebloPuerto RicanPuget Sound SalishRomanianRussianSalvadoranSamoanScandinavianScotch-IrishScottishSeminoleSenegaleseSerbianShoshoneSierra LeoneanSiouxSlavicSlovakSloveneSomaliSouth AfricanSouth AmericanSouth American IndianSoviet UnionSpaniardSpanishSpanish AmericanSpanish American IndianSri LankanSubsaharan AfricanSudaneseSwedishSwissSyrianTaiwaneseThaiTlingit-HaidaTohono O'OdhamTonganTrinidadian and TobagonianTsimshianTurkishU.S. Virgin IslanderUgandanUkrainianUruguayanUteVenezuelanVietnameseWelshWest IndianYakamaYaquiYugoslavianYumanYup'ikZimbabwean
Immigration
NonimmigrantsImmigrantsAfghanistanAfricaAlbaniaArgentinaArmeniaAsiaAustraliaAustriaBahamasBangladeshBarbadosBelarusBelgiumBelizeBoliviaBosnia and HerzegovinaBrazilBulgariaBurma/MyanmarCabo VerdeCambodiaCameroonCanadaCaribbeanCentral AmericaChileChinaColombiaCongoCosta RicaCroatiaCubaCzechoslovakiaDenmarkDominicaDominican RepublicEastern AfricaEastern AsiaEastern EuropeEcuadorEgyptEl SalvadorEnglandEritreaEthiopiaEuropeFijiFranceGermanyGhanaGreeceGrenadaGuatemalaGuyanaHaitiHondurasHong KongHungaryIndiaIndonesiaIranIraqIrelandIsraelItalyJamaicaJapanJordanKazakhstanKenyaKoreaKuwaitLaosLatin AmericaLatviaLebanonLiberiaLithuaniaMalaysiaMexicoMicronesiaMiddle AfricaMoldovaMoroccoNepalNetherlandsNicaraguaNigeriaNorth AmericaNorth MacedoniaNorthern AfricaNorthern EuropeNorwayOceaniaPakistanPanamaPeruPhilippinesPolandPortugalRomaniaRussiaSaudi ArabiaScotlandSenegalSerbiaSierra LeoneSingaporeSomaliaSouth AfricaSouth AmericaSouth Central AsiaSouth Eastern AsiaSouthern EuropeSpainSri LankaSt. Vincent and the GrenadinesSudanSwedenSwitzerlandSyriaTaiwanThailandTrinidad and TobagoTurkeyUgandaUkraineUruguayUzbekistanVenezuelaVietnamWest IndiesWestern AsiaWestern EuropeYemenZaireZimbabweAzores
Immigrants from Western Africa
Race
Ancestry
AfghanAfricanAlaska NativeAlaskan AthabascanAlbanianAleutAlsatianAmericanApacheArabArapahoArgentineanArmenianAssyrian/Chaldean/SyriacAustralianAustrianBahamianBangladeshiBarbadianBasqueBelgianBelizeanBermudanBhutaneseBlackfeetBolivianBrazilianBritishBritish West IndianBulgarianBurmeseCajunCambodianCanadianCape VerdeanCarpatho RusynCelticCentral AmericanCentral American IndianCherokeeCheyenneChickasawChileanChineseChippewaChoctawColombianColvilleComancheCosta RicanCreeCreekCroatianCrowCubanCypriotCzechCzechoslovakianDanishDelawareDominicanDutchDutch West IndianEastern EuropeanEcuadorianEgyptianEnglishEstonianEthiopianEuropeanFijianFilipinoFinnishFrenchFrench American IndianFrench CanadianGermanGerman RussianGhanaianGuamanian/ChamorroGuatemalanGuyaneseHaitianHmongHonduranHopiHoumaHungarianIcelanderIndian (Asian)IndonesianInupiatIranianIraqiIrishIroquoisIsraeliItalianJamaicanJapaneseJordanianKenyanKiowaKoreanLaotianLatvianLebaneseLiberianLithuanianLumbeeLuxembourgerMacedonianMalaysianMalteseMarshalleseMenomineeMexicanMexican American IndianMongolianMoroccanNative HawaiianNavajoNepaleseNew ZealanderNicaraguanNigerianNorthern EuropeanNorwegianOkinawanOsageOttawaPaiutePakistaniPalestinianPanamanianParaguayanPennsylvania GermanPeruvianPimaPolishPortuguesePotawatomiPuebloPuerto RicanPuget Sound SalishRomanianRussianSalvadoranSamoanScandinavianScotch-IrishScottishSeminoleSenegaleseSerbianShoshoneSierra LeoneanSiouxSlavicSlovakSloveneSomaliSouth AfricanSouth AmericanSouth American IndianSoviet UnionSpaniardSpanishSpanish AmericanSpanish American IndianSri LankanSubsaharan AfricanSudaneseSwedishSwissSyrianTaiwaneseThaiTlingit-HaidaTohono O'OdhamTonganTrinidadian and TobagonianTsimshianTurkishU.S. Virgin IslanderUgandanUkrainianUruguayanUteVenezuelanVietnameseWelshWest IndianYakamaYaquiYugoslavianYumanYup'ikZimbabwean
Immigration
NonimmigrantsImmigrantsAfghanistanAfricaAlbaniaArgentinaArmeniaAsiaAustraliaAustriaBahamasBangladeshBarbadosBelarusBelgiumBelizeBoliviaBosnia and HerzegovinaBrazilBulgariaBurma/MyanmarCabo VerdeCambodiaCameroonCanadaCaribbeanCentral AmericaChileChinaColombiaCongoCosta RicaCroatiaCubaCzechoslovakiaDenmarkDominicaDominican RepublicEastern AfricaEastern AsiaEastern EuropeEcuadorEgyptEl SalvadorEnglandEritreaEthiopiaEuropeFijiFranceGermanyGhanaGreeceGrenadaGuatemalaGuyanaHaitiHondurasHong KongHungaryIndiaIndonesiaIranIraqIrelandIsraelItalyJamaicaJapanJordanKazakhstanKenyaKoreaKuwaitLaosLatin AmericaLatviaLebanonLiberiaLithuaniaMalaysiaMexicoMicronesiaMiddle AfricaMoldovaMoroccoNepalNetherlandsNicaraguaNigeriaNorth AmericaNorth MacedoniaNorthern AfricaNorthern EuropeNorwayOceaniaPakistanPanamaPeruPhilippinesPolandPortugalRomaniaRussiaSaudi ArabiaScotlandSenegalSerbiaSierra LeoneSingaporeSomaliaSouth AfricaSouth AmericaSouth Central AsiaSouth Eastern AsiaSouthern EuropeSpainSri LankaSt. Vincent and the GrenadinesSudanSwedenSwitzerlandSyriaTaiwanThailandTrinidad and TobagoTurkeyUgandaUkraineUruguayUzbekistanVenezuelaVietnamWest IndiesWestern AfricaWestern AsiaWestern EuropeYemenZaireZimbabweAzores
Unemployment Among Ages 60 to 64 years
Income
Poverty
Unemployment
Labor Participation
Family Structure
Vehicle Availability
Education Level
Disability

Unemployment Among Ages 60 to 64 years Comparison

Greeks

Immigrants from Western Africa

Exceptional
Fair
4.7%
UNEMPLOYMENT AMONG AGES 60 TO 64 YEARS
97.5/ 100
METRIC RATING
107th/ 347
METRIC RANK
4.9%
UNEMPLOYMENT AMONG AGES 60 TO 64 YEARS
20.6/ 100
METRIC RATING
202nd/ 347
METRIC RANK

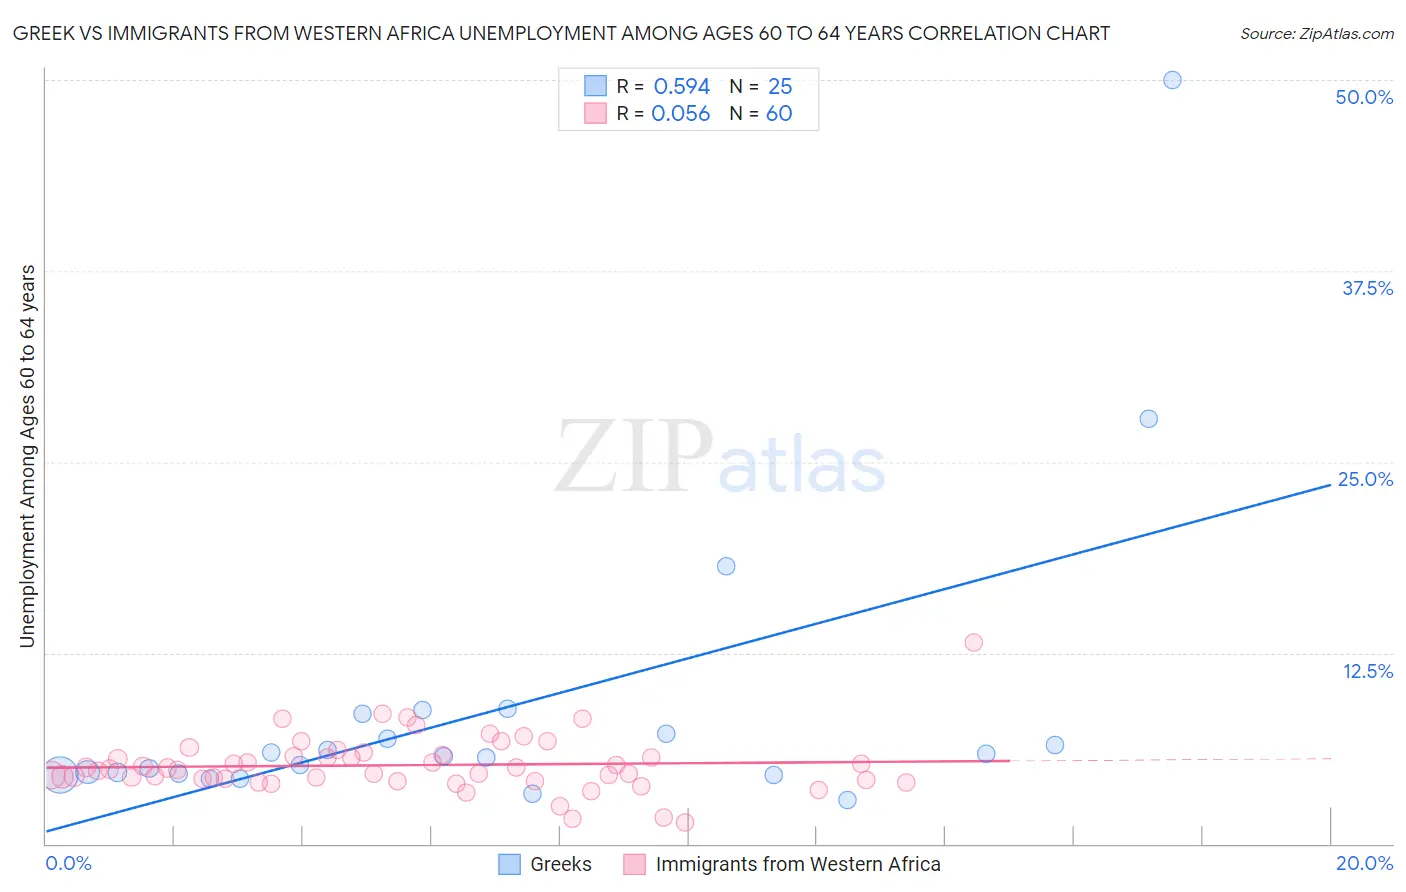
Greek vs Immigrants from Western Africa Unemployment Among Ages 60 to 64 years Correlation Chart

The statistical analysis conducted on geographies consisting of 420,815,200 people shows a substantial positive correlation between the proportion of Greeks and unemployment rate among population between the ages 60 and 64 in the United States with a correlation coefficient (R) of 0.594 and weighted average of 4.7%. Similarly, the statistical analysis conducted on geographies consisting of 328,663,642 people shows a slight positive correlation between the proportion of Immigrants from Western Africa and unemployment rate among population between the ages 60 and 64 in the United States with a correlation coefficient (R) of 0.056 and weighted average of 4.9%, a difference of 4.6%.
Greek vs Immigrants from Western Africa Unemployment Among Ages 60 to 64 years

Unemployment Among Ages 60 to 64 years Correlation Summary

MeasurementGreekImmigrants from Western Africa
Minimum2.9%1.4%
Maximum50.0%13.2%
Range47.1%11.8%
Mean8.8%5.1%
Median5.7%4.9%
Interquartile 25% (IQ1)4.6%4.2%
Interquartile 75% (IQ3)7.9%5.8%
Interquartile Range (IQR)3.3%1.5%
Standard Deviation (Sample)10.0%1.9%
Standard Deviation (Population)9.8%1.8%

Similar Demographics by Unemployment Among Ages 60 to 64 years

Demographics Similar to Greeks by Unemployment Among Ages 60 to 64 years

In terms of unemployment among ages 60 to 64 years, the demographic groups most similar to Greeks are Immigrants from North America (4.7%, a difference of 0.010%), Canadian (4.7%, a difference of 0.040%), Immigrants from Japan (4.7%, a difference of 0.040%), Immigrants from Netherlands (4.7%, a difference of 0.040%), and Paraguayan (4.7%, a difference of 0.070%).
DemographicsRating | RankUnemployment Among Ages 60 to 64 years
Portuguese
97.9
/100
|
#100
Exceptional
4.7%
Malaysians
97.9
/100
|
#101
Exceptional
4.7%
Immigrants | Canada
97.8
/100
|
#102
Exceptional
4.7%
Whites/Caucasians
97.8
/100
|
#103
Exceptional
4.7%
Paraguayans
97.7
/100
|
#104
Exceptional
4.7%
Canadians
97.7
/100
|
#105
Exceptional
4.7%
Immigrants | North America
97.6
/100
|
#106
Exceptional
4.7%
Greeks
97.5
/100
|
#107
Exceptional
4.7%
Immigrants | Japan
97.4
/100
|
#108
Exceptional
4.7%
Immigrants | Netherlands
97.4
/100
|
#109
Exceptional
4.7%
Ethiopians
97.2
/100
|
#110
Exceptional
4.7%
French
97.1
/100
|
#111
Exceptional
4.7%
Syrians
97.0
/100
|
#112
Exceptional
4.7%
Bulgarians
96.6
/100
|
#113
Exceptional
4.7%
Maltese
96.5
/100
|
#114
Exceptional
4.7%

Demographics Similar to Immigrants from Western Africa by Unemployment Among Ages 60 to 64 years

In terms of unemployment among ages 60 to 64 years, the demographic groups most similar to Immigrants from Western Africa are Uruguayan (4.9%, a difference of 0.040%), Colombian (4.9%, a difference of 0.10%), Russian (4.9%, a difference of 0.10%), Immigrants from Czechoslovakia (4.9%, a difference of 0.15%), and Guamanian/Chamorro (4.9%, a difference of 0.16%).
DemographicsRating | RankUnemployment Among Ages 60 to 64 years
Immigrants | Austria
26.6
/100
|
#195
Fair
4.9%
Immigrants | Asia
25.7
/100
|
#196
Fair
4.9%
Immigrants | Eastern Europe
25.2
/100
|
#197
Fair
4.9%
Guamanians/Chamorros
23.7
/100
|
#198
Fair
4.9%
Immigrants | Vietnam
23.7
/100
|
#199
Fair
4.9%
Immigrants | Czechoslovakia
23.5
/100
|
#200
Fair
4.9%
Colombians
22.7
/100
|
#201
Fair
4.9%
Immigrants | Western Africa
20.6
/100
|
#202
Fair
4.9%
Uruguayans
19.9
/100
|
#203
Poor
4.9%
Russians
18.9
/100
|
#204
Poor
4.9%
Immigrants | Indonesia
17.4
/100
|
#205
Poor
4.9%
New Zealanders
17.4
/100
|
#206
Poor
4.9%
Chippewa
17.3
/100
|
#207
Poor
4.9%
German Russians
16.8
/100
|
#208
Poor
4.9%
Sierra Leoneans
16.5
/100
|
#209
Poor
4.9%