Ghanaian vs Immigrants from Kuwait Unemployment Among Seniors over 75 years
COMPARE
Ghanaian
Immigrants from Kuwait
Unemployment Among Seniors over 75 years
Unemployment Among Seniors over 75 years Comparison
Ghanaians
Immigrants from Kuwait
8.4%
UNEMPLOYMENT AMONG SENIORS OVER 75 YEARS
96.0/ 100
METRIC RATING
129th/ 347
METRIC RANK
8.5%
UNEMPLOYMENT AMONG SENIORS OVER 75 YEARS
90.5/ 100
METRIC RATING
137th/ 347
METRIC RANK
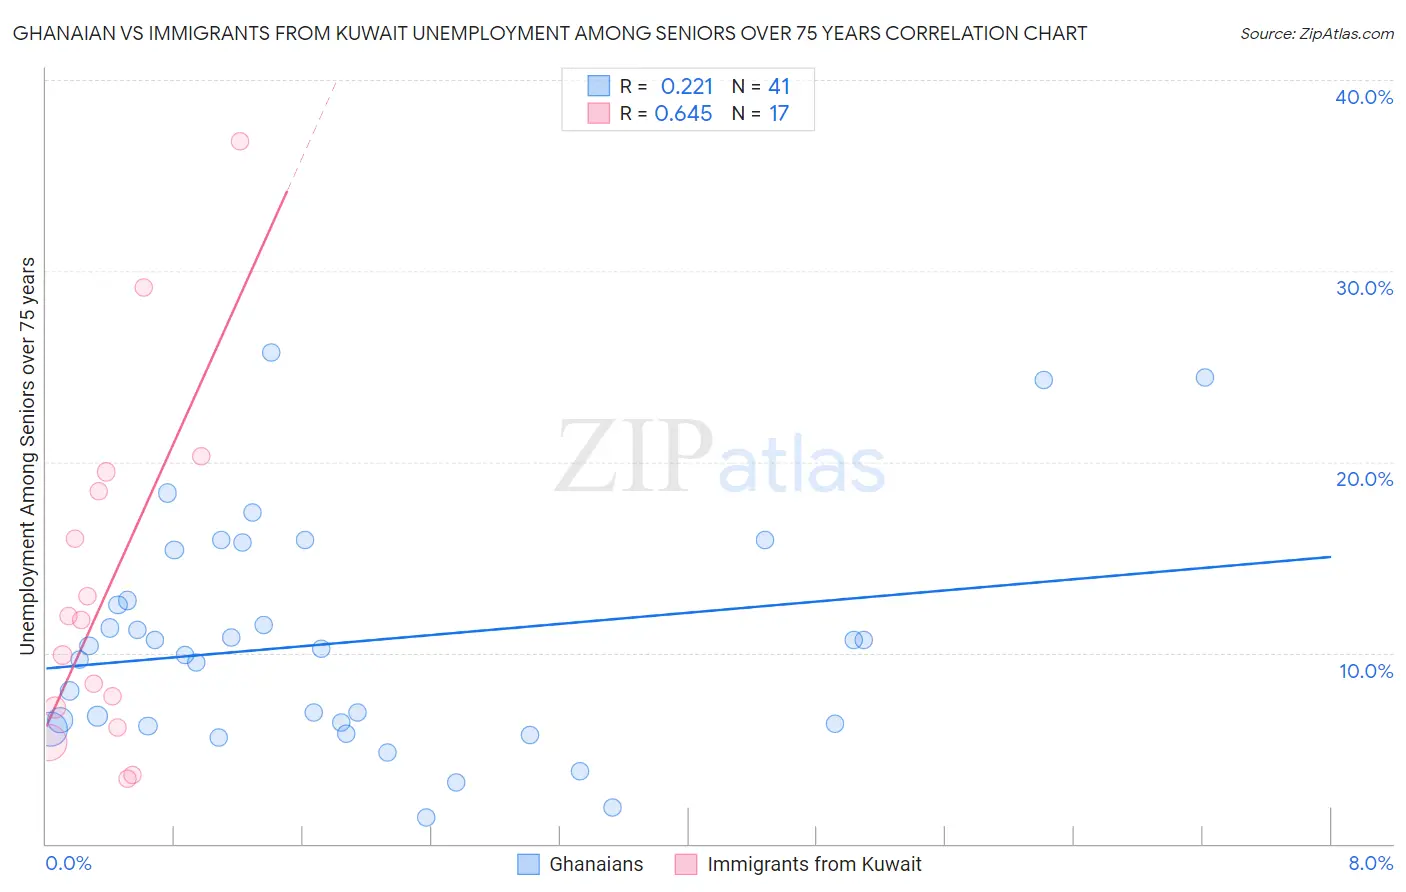
Ghanaian vs Immigrants from Kuwait Unemployment Among Seniors over 75 years Correlation Chart
The statistical analysis conducted on geographies consisting of 121,858,478 people shows a weak positive correlation between the proportion of Ghanaians and unemployment rate among seniors over the age of 75 in the United States with a correlation coefficient (R) of 0.221 and weighted average of 8.4%. Similarly, the statistical analysis conducted on geographies consisting of 97,784,718 people shows a significant positive correlation between the proportion of Immigrants from Kuwait and unemployment rate among seniors over the age of 75 in the United States with a correlation coefficient (R) of 0.645 and weighted average of 8.5%, a difference of 1.3%.
Unemployment Among Seniors over 75 years Correlation Summary
| Measurement | Ghanaian | Immigrants from Kuwait |
| Minimum | 1.4% | 3.4% |
| Maximum | 25.7% | 36.8% |
| Range | 24.3% | 33.4% |
| Mean | 10.5% | 13.4% |
| Median | 10.2% | 11.7% |
| Interquartile 25% (IQ1) | 6.2% | 6.6% |
| Interquartile 75% (IQ3) | 14.1% | 19.0% |
| Interquartile Range (IQR) | 7.9% | 12.3% |
| Standard Deviation (Sample) | 5.9% | 9.1% |
| Standard Deviation (Population) | 5.8% | 8.9% |
Demographics Similar to Ghanaians and Immigrants from Kuwait by Unemployment Among Seniors over 75 years
In terms of unemployment among seniors over 75 years, the demographic groups most similar to Ghanaians are Native Hawaiian (8.4%, a difference of 0.030%), Honduran (8.4%, a difference of 0.080%), Belizean (8.4%, a difference of 0.090%), Apache (8.4%, a difference of 0.28%), and Immigrants from Moldova (8.3%, a difference of 0.29%). Similarly, the demographic groups most similar to Immigrants from Kuwait are Immigrants from Trinidad and Tobago (8.5%, a difference of 0.040%), Immigrants from Bulgaria (8.5%, a difference of 0.14%), Haitian (8.5%, a difference of 0.15%), Barbadian (8.5%, a difference of 0.28%), and South American (8.5%, a difference of 0.38%).
| Demographics | Rating | Rank | Unemployment Among Seniors over 75 years |
| Immigrants | Nepal | 96.9 /100 | #123 | Exceptional 8.3% |
| Thais | 96.8 /100 | #124 | Exceptional 8.3% |
| Immigrants | Moldova | 96.7 /100 | #125 | Exceptional 8.3% |
| Belizeans | 96.3 /100 | #126 | Exceptional 8.4% |
| Hondurans | 96.2 /100 | #127 | Exceptional 8.4% |
| Native Hawaiians | 96.1 /100 | #128 | Exceptional 8.4% |
| Ghanaians | 96.0 /100 | #129 | Exceptional 8.4% |
| Apache | 95.2 /100 | #130 | Exceptional 8.4% |
| German Russians | 94.9 /100 | #131 | Exceptional 8.4% |
| Chileans | 93.8 /100 | #132 | Exceptional 8.4% |
| Serbians | 93.7 /100 | #133 | Exceptional 8.4% |
| Immigrants | Czechoslovakia | 93.4 /100 | #134 | Exceptional 8.4% |
| Haitians | 91.4 /100 | #135 | Exceptional 8.5% |
| Immigrants | Trinidad and Tobago | 90.8 /100 | #136 | Exceptional 8.5% |
| Immigrants | Kuwait | 90.5 /100 | #137 | Exceptional 8.5% |
| Immigrants | Bulgaria | 89.6 /100 | #138 | Excellent 8.5% |
| Barbadians | 88.6 /100 | #139 | Excellent 8.5% |
| South Americans | 87.9 /100 | #140 | Excellent 8.5% |
| Immigrants | Bolivia | 87.9 /100 | #141 | Excellent 8.5% |
| Immigrants | Ukraine | 87.0 /100 | #142 | Excellent 8.5% |
| Immigrants | Costa Rica | 86.8 /100 | #143 | Excellent 8.5% |