German vs Peruvian Unemployment Among Ages 45 to 54 years
COMPARE
German
Peruvian
Unemployment Among Ages 45 to 54 years
Unemployment Among Ages 45 to 54 years Comparison
Germans
Peruvians
4.1%
UNEMPLOYMENT AMONG AGES 45 TO 54 YEARS
100.0/ 100
METRIC RATING
18th/ 347
METRIC RANK
4.6%
UNEMPLOYMENT AMONG AGES 45 TO 54 YEARS
31.5/ 100
METRIC RATING
195th/ 347
METRIC RANK
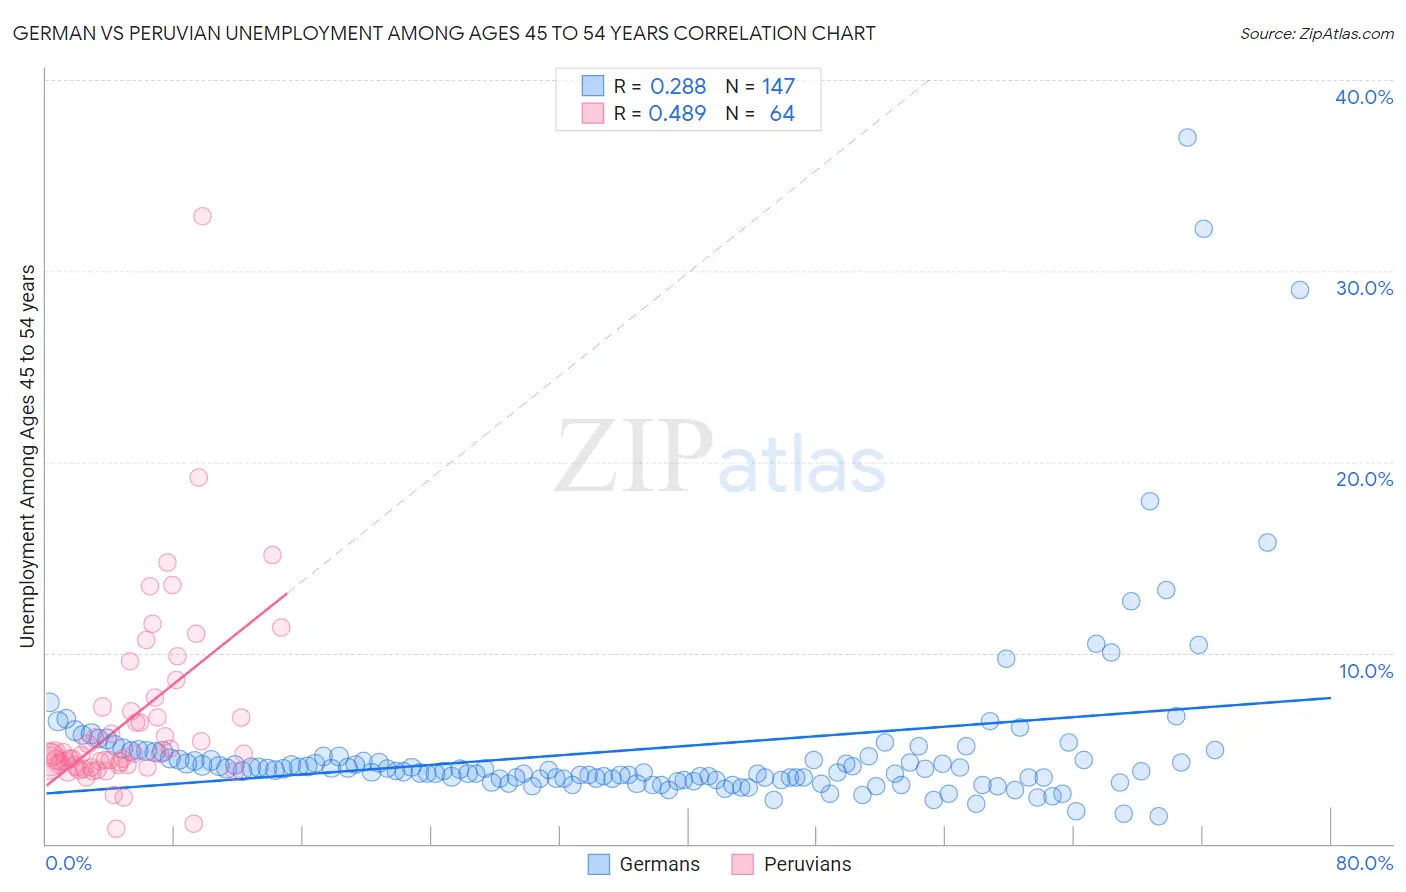
German vs Peruvian Unemployment Among Ages 45 to 54 years Correlation Chart
The statistical analysis conducted on geographies consisting of 533,496,511 people shows a weak positive correlation between the proportion of Germans and unemployment rate among population between the ages 45 and 54 in the United States with a correlation coefficient (R) of 0.288 and weighted average of 4.1%. Similarly, the statistical analysis conducted on geographies consisting of 356,357,683 people shows a moderate positive correlation between the proportion of Peruvians and unemployment rate among population between the ages 45 and 54 in the United States with a correlation coefficient (R) of 0.489 and weighted average of 4.6%, a difference of 12.5%.
Unemployment Among Ages 45 to 54 years Correlation Summary
| Measurement | German | Peruvian |
| Minimum | 1.4% | 0.82% |
| Maximum | 37.0% | 32.8% |
| Range | 35.6% | 32.0% |
| Mean | 4.9% | 6.4% |
| Median | 3.9% | 4.6% |
| Interquartile 25% (IQ1) | 3.4% | 4.1% |
| Interquartile 75% (IQ3) | 4.6% | 6.8% |
| Interquartile Range (IQR) | 1.2% | 2.7% |
| Standard Deviation (Sample) | 4.7% | 4.9% |
| Standard Deviation (Population) | 4.6% | 4.8% |
Similar Demographics by Unemployment Among Ages 45 to 54 years
Demographics Similar to Germans by Unemployment Among Ages 45 to 54 years
In terms of unemployment among ages 45 to 54 years, the demographic groups most similar to Germans are Tongan (4.1%, a difference of 0.020%), Swiss (4.1%, a difference of 0.29%), English (4.1%, a difference of 0.45%), Thai (4.0%, a difference of 0.56%), and Immigrants from Bolivia (4.0%, a difference of 0.76%).
| Demographics | Rating | Rank | Unemployment Among Ages 45 to 54 years |
| Scandinavians | 100.0 /100 | #11 | Exceptional 4.0% |
| Swedes | 100.0 /100 | #12 | Exceptional 4.0% |
| Cubans | 100.0 /100 | #13 | Exceptional 4.0% |
| Immigrants | Bosnia and Herzegovina | 100.0 /100 | #14 | Exceptional 4.0% |
| Immigrants | Bolivia | 100.0 /100 | #15 | Exceptional 4.0% |
| Thais | 100.0 /100 | #16 | Exceptional 4.0% |
| Tongans | 100.0 /100 | #17 | Exceptional 4.1% |
| Germans | 100.0 /100 | #18 | Exceptional 4.1% |
| Swiss | 100.0 /100 | #19 | Exceptional 4.1% |
| English | 100.0 /100 | #20 | Exceptional 4.1% |
| Europeans | 100.0 /100 | #21 | Exceptional 4.1% |
| Yugoslavians | 100.0 /100 | #22 | Exceptional 4.1% |
| Bulgarians | 100.0 /100 | #23 | Exceptional 4.1% |
| Carpatho Rusyns | 100.0 /100 | #24 | Exceptional 4.1% |
| Bolivians | 99.9 /100 | #25 | Exceptional 4.1% |
Demographics Similar to Peruvians by Unemployment Among Ages 45 to 54 years
In terms of unemployment among ages 45 to 54 years, the demographic groups most similar to Peruvians are Estonian (4.6%, a difference of 0.020%), Albanian (4.6%, a difference of 0.020%), Immigrants from Belarus (4.6%, a difference of 0.050%), South American (4.6%, a difference of 0.070%), and Immigrants from Lithuania (4.6%, a difference of 0.090%).
| Demographics | Rating | Rank | Unemployment Among Ages 45 to 54 years |
| Immigrants | Sierra Leone | 36.3 /100 | #188 | Fair 4.6% |
| Immigrants | Laos | 35.7 /100 | #189 | Fair 4.6% |
| Immigrants | Serbia | 34.8 /100 | #190 | Fair 4.6% |
| Immigrants | Uruguay | 34.4 /100 | #191 | Fair 4.6% |
| Immigrants | Thailand | 34.1 /100 | #192 | Fair 4.6% |
| Immigrants | Lithuania | 33.2 /100 | #193 | Fair 4.6% |
| South Americans | 32.9 /100 | #194 | Fair 4.6% |
| Peruvians | 31.5 /100 | #195 | Fair 4.6% |
| Estonians | 31.2 /100 | #196 | Fair 4.6% |
| Albanians | 31.1 /100 | #197 | Fair 4.6% |
| Immigrants | Belarus | 30.6 /100 | #198 | Fair 4.6% |
| Brazilians | 20.1 /100 | #199 | Fair 4.6% |
| Immigrants | Denmark | 19.8 /100 | #200 | Poor 4.6% |
| Immigrants | Costa Rica | 19.7 /100 | #201 | Poor 4.6% |
| Immigrants | Peru | 19.1 /100 | #202 | Poor 4.6% |