French Canadian vs Assyrian/Chaldean/Syriac Unemployment Among Ages 35 to 44 years

COMPARE

French Canadian
Race
Ancestry
AfghanAfricanAlaska NativeAlaskan AthabascanAlbanianAleutAlsatianAmericanApacheArabArapahoArgentineanArmenianAustralianAustrianBahamianBangladeshiBarbadianBasqueBelgianBelizeanBermudanBhutaneseBlackfeetBolivianBrazilianBritishBritish West IndianBulgarianBurmeseCajunCambodianCanadianCape VerdeanCarpatho RusynCelticCentral AmericanCentral American IndianCherokeeCheyenneChickasawChileanChineseChippewaChoctawColombianColvilleComancheCosta RicanCreeCreekCroatianCrowCubanCypriotCzechCzechoslovakianDanishDelawareDominicanDutchDutch West IndianEastern EuropeanEcuadorianEgyptianEnglishEstonianEthiopianEuropeanFijianFilipinoFinnishFrenchFrench American IndianFrench CanadianGermanGerman RussianGhanaianGreekGuamanian/ChamorroGuatemalanGuyaneseHaitianHmongHonduranHopiHoumaHungarianIcelanderIndian (Asian)IndonesianInupiatIranianIraqiIrishIroquoisIsraeliItalianJamaicanJapaneseJordanianKenyanKiowaKoreanLaotianLatvianLebaneseLiberianLithuanianLumbeeLuxembourgerMacedonianMalaysianMalteseMarshalleseMenomineeMexicanMexican American IndianMongolianMoroccanNative HawaiianNavajoNepaleseNew ZealanderNicaraguanNigerianNorthern EuropeanNorwegianOkinawanOsageOttawaPaiutePakistaniPalestinianPanamanianParaguayanPennsylvania GermanPeruvianPimaPolishPortuguesePotawatomiPuebloPuerto RicanPuget Sound SalishRomanianRussianSalvadoranSamoanScandinavianScotch-IrishScottishSeminoleSenegaleseSerbianShoshoneSierra LeoneanSiouxSlavicSlovakSloveneSomaliSouth AfricanSouth AmericanSouth American IndianSoviet UnionSpaniardSpanishSpanish AmericanSpanish American IndianSri LankanSubsaharan AfricanSudaneseSwedishSwissSyrianTaiwaneseThaiTlingit-HaidaTohono O'OdhamTonganTrinidadian and TobagonianTsimshianTurkishU.S. Virgin IslanderUgandanUkrainianUruguayanUteVenezuelanVietnameseWelshWest IndianYakamaYaquiYugoslavianYumanYup'ikZimbabwean
Immigration
NonimmigrantsImmigrantsAfghanistanAfricaAlbaniaArgentinaArmeniaAsiaAustraliaAustriaBahamasBangladeshBarbadosBelarusBelgiumBelizeBoliviaBosnia and HerzegovinaBrazilBulgariaBurma/MyanmarCabo VerdeCambodiaCameroonCanadaCaribbeanCentral AmericaChileChinaColombiaCongoCosta RicaCroatiaCubaCzechoslovakiaDenmarkDominicaDominican RepublicEastern AfricaEastern AsiaEastern EuropeEcuadorEgyptEl SalvadorEnglandEritreaEthiopiaEuropeFijiFranceGermanyGhanaGreeceGrenadaGuatemalaGuyanaHaitiHondurasHong KongHungaryIndiaIndonesiaIranIraqIrelandIsraelItalyJamaicaJapanJordanKazakhstanKenyaKoreaKuwaitLaosLatin AmericaLatviaLebanonLiberiaLithuaniaMalaysiaMexicoMicronesiaMiddle AfricaMoldovaMoroccoNepalNetherlandsNicaraguaNigeriaNorth AmericaNorth MacedoniaNorthern AfricaNorthern EuropeNorwayOceaniaPakistanPanamaPeruPhilippinesPolandPortugalRomaniaRussiaSaudi ArabiaScotlandSenegalSerbiaSierra LeoneSingaporeSomaliaSouth AfricaSouth AmericaSouth Central AsiaSouth Eastern AsiaSouthern EuropeSpainSri LankaSt. Vincent and the GrenadinesSudanSwedenSwitzerlandSyriaTaiwanThailandTrinidad and TobagoTurkeyUgandaUkraineUruguayUzbekistanVenezuelaVietnamWest IndiesWestern AfricaWestern AsiaWestern EuropeYemenZaireZimbabweAzores
Assyrian/Chaldean/Syriac
Race
Ancestry
AfghanAfricanAlaska NativeAlaskan AthabascanAlbanianAleutAlsatianAmericanApacheArabArapahoArgentineanArmenianAssyrian/Chaldean/SyriacAustralianAustrianBahamianBangladeshiBarbadianBasqueBelgianBelizeanBermudanBhutaneseBlackfeetBolivianBrazilianBritishBritish West IndianBulgarianBurmeseCajunCambodianCanadianCape VerdeanCarpatho RusynCelticCentral AmericanCentral American IndianCherokeeCheyenneChickasawChileanChineseChippewaChoctawColombianColvilleComancheCosta RicanCreeCreekCroatianCrowCubanCypriotCzechCzechoslovakianDanishDelawareDominicanDutchDutch West IndianEastern EuropeanEcuadorianEgyptianEnglishEstonianEthiopianEuropeanFijianFilipinoFinnishFrenchFrench American IndianGermanGerman RussianGhanaianGreekGuamanian/ChamorroGuatemalanGuyaneseHaitianHmongHonduranHopiHoumaHungarianIcelanderIndian (Asian)IndonesianInupiatIranianIraqiIrishIroquoisIsraeliItalianJamaicanJapaneseJordanianKenyanKiowaKoreanLaotianLatvianLebaneseLiberianLithuanianLumbeeLuxembourgerMacedonianMalaysianMalteseMarshalleseMenomineeMexicanMexican American IndianMongolianMoroccanNative HawaiianNavajoNepaleseNew ZealanderNicaraguanNigerianNorthern EuropeanNorwegianOkinawanOsageOttawaPaiutePakistaniPalestinianPanamanianParaguayanPennsylvania GermanPeruvianPimaPolishPortuguesePotawatomiPuebloPuerto RicanPuget Sound SalishRomanianRussianSalvadoranSamoanScandinavianScotch-IrishScottishSeminoleSenegaleseSerbianShoshoneSierra LeoneanSiouxSlavicSlovakSloveneSomaliSouth AfricanSouth AmericanSouth American IndianSoviet UnionSpaniardSpanishSpanish AmericanSpanish American IndianSri LankanSubsaharan AfricanSudaneseSwedishSwissSyrianTaiwaneseThaiTlingit-HaidaTohono O'OdhamTonganTrinidadian and TobagonianTsimshianTurkishU.S. Virgin IslanderUgandanUkrainianUruguayanUteVenezuelanVietnameseWelshWest IndianYakamaYaquiYugoslavianYumanYup'ikZimbabwean
Immigration
NonimmigrantsImmigrantsAfghanistanAfricaAlbaniaArgentinaArmeniaAsiaAustraliaAustriaBahamasBangladeshBarbadosBelarusBelgiumBelizeBoliviaBosnia and HerzegovinaBrazilBulgariaBurma/MyanmarCabo VerdeCambodiaCameroonCanadaCaribbeanCentral AmericaChileChinaColombiaCongoCosta RicaCroatiaCubaCzechoslovakiaDenmarkDominicaDominican RepublicEastern AfricaEastern AsiaEastern EuropeEcuadorEgyptEl SalvadorEnglandEritreaEthiopiaEuropeFijiFranceGermanyGhanaGreeceGrenadaGuatemalaGuyanaHaitiHondurasHong KongHungaryIndiaIndonesiaIranIraqIrelandIsraelItalyJamaicaJapanJordanKazakhstanKenyaKoreaKuwaitLaosLatin AmericaLatviaLebanonLiberiaLithuaniaMalaysiaMexicoMicronesiaMiddle AfricaMoldovaMoroccoNepalNetherlandsNicaraguaNigeriaNorth AmericaNorth MacedoniaNorthern AfricaNorthern EuropeNorwayOceaniaPakistanPanamaPeruPhilippinesPolandPortugalRomaniaRussiaSaudi ArabiaScotlandSenegalSerbiaSierra LeoneSingaporeSomaliaSouth AfricaSouth AmericaSouth Central AsiaSouth Eastern AsiaSouthern EuropeSpainSri LankaSt. Vincent and the GrenadinesSudanSwedenSwitzerlandSyriaTaiwanThailandTrinidad and TobagoTurkeyUgandaUkraineUruguayUzbekistanVenezuelaVietnamWest IndiesWestern AfricaWestern AsiaWestern EuropeYemenZaireZimbabweAzores
Unemployment Among Ages 35 to 44 years
Income
Poverty
Unemployment
Labor Participation
Family Structure
Vehicle Availability
Education Level
Disability

Unemployment Among Ages 35 to 44 years Comparison

French Canadians

Assyrians/Chaldeans/Syriacs

Poor
Exceptional
4.8%
UNEMPLOYMENT AMONG AGES 35 TO 44 YEARS
16.5/ 100
METRIC RATING
208th/ 347
METRIC RANK
4.3%
UNEMPLOYMENT AMONG AGES 35 TO 44 YEARS
99.3/ 100
METRIC RATING
27th/ 347
METRIC RANK

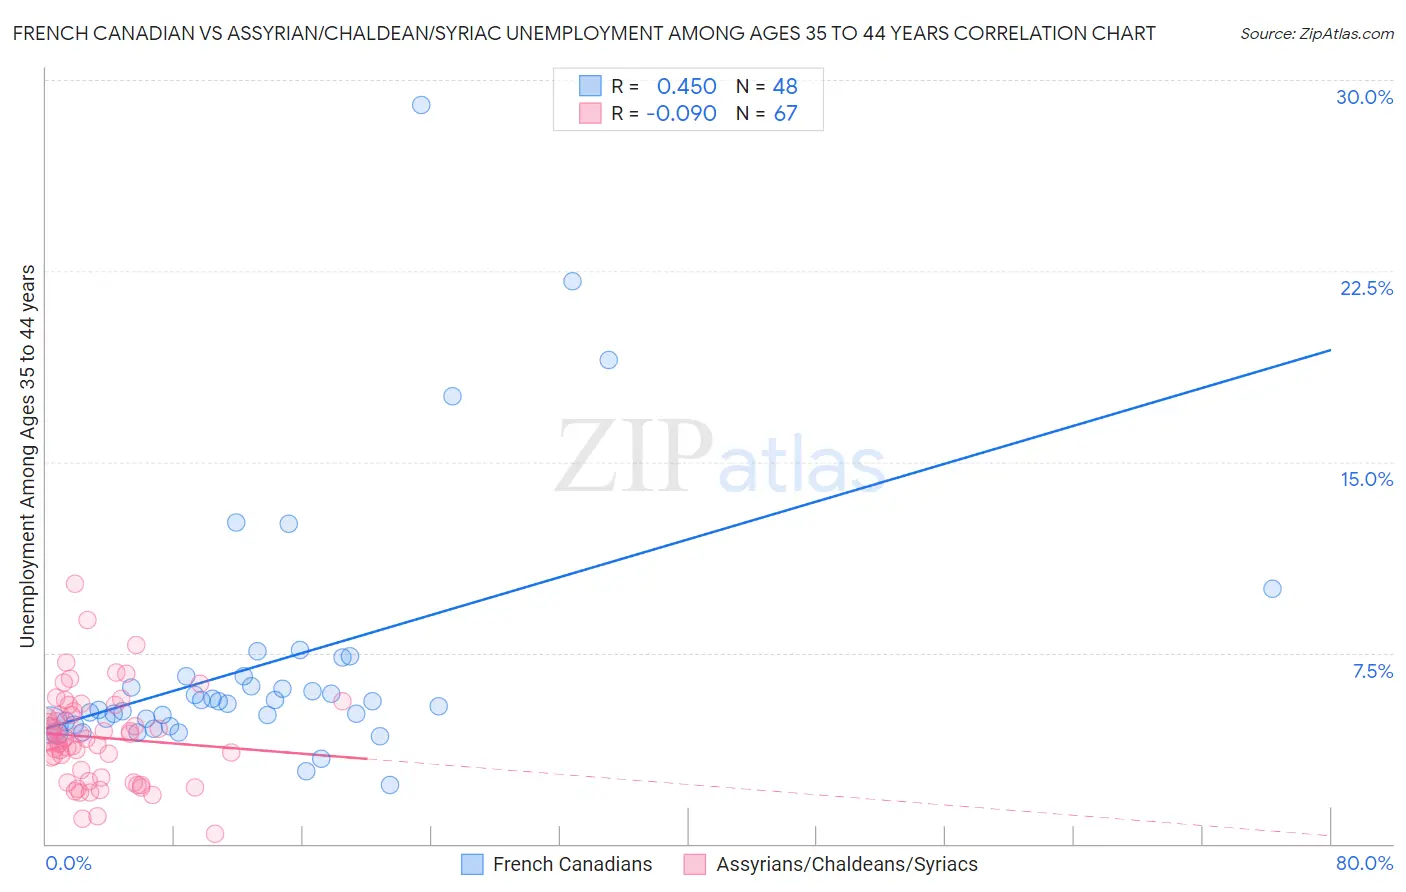
French Canadian vs Assyrian/Chaldean/Syriac Unemployment Among Ages 35 to 44 years Correlation Chart

The statistical analysis conducted on geographies consisting of 478,615,928 people shows a moderate positive correlation between the proportion of French Canadians and unemployment rate among population between the ages 35 and 44 in the United States with a correlation coefficient (R) of 0.450 and weighted average of 4.8%. Similarly, the statistical analysis conducted on geographies consisting of 109,865,928 people shows a slight negative correlation between the proportion of Assyrians/Chaldeans/Syriacs and unemployment rate among population between the ages 35 and 44 in the United States with a correlation coefficient (R) of -0.090 and weighted average of 4.3%, a difference of 12.8%.
French Canadian vs Assyrian/Chaldean/Syriac Unemployment Among Ages 35 to 44 years

Unemployment Among Ages 35 to 44 years Correlation Summary

MeasurementFrench CanadianAssyrian/Chaldean/Syriac
Minimum2.3%0.40%
Maximum29.0%10.2%
Range26.7%9.8%
Mean7.1%4.2%
Median5.5%4.1%
Interquartile 25% (IQ1)4.7%2.6%
Interquartile 75% (IQ3)6.6%5.2%
Interquartile Range (IQR)1.8%2.6%
Standard Deviation (Sample)5.1%1.8%
Standard Deviation (Population)5.0%1.8%

Similar Demographics by Unemployment Among Ages 35 to 44 years

Demographics Similar to French Canadians by Unemployment Among Ages 35 to 44 years

In terms of unemployment among ages 35 to 44 years, the demographic groups most similar to French Canadians are Immigrants from Western Asia (4.8%, a difference of 0.020%), Soviet Union (4.8%, a difference of 0.23%), Spaniard (4.8%, a difference of 0.27%), Immigrants from Philippines (4.8%, a difference of 0.39%), and Uruguayan (4.8%, a difference of 0.41%).
DemographicsRating | RankUnemployment Among Ages 35 to 44 years
Ugandans
21.4
/100
|
#201
Fair
4.8%
Immigrants | Afghanistan
20.2
/100
|
#202
Fair
4.8%
Uruguayans
20.0
/100
|
#203
Fair
4.8%
Immigrants | Philippines
19.8
/100
|
#204
Poor
4.8%
Spaniards
18.7
/100
|
#205
Poor
4.8%
Soviet Union
18.4
/100
|
#206
Poor
4.8%
Immigrants | Western Asia
16.6
/100
|
#207
Poor
4.8%
French Canadians
16.5
/100
|
#208
Poor
4.8%
Immigrants | Uruguay
11.5
/100
|
#209
Poor
4.9%
Immigrants | Cameroon
11.4
/100
|
#210
Poor
4.9%
Immigrants | Nonimmigrants
9.4
/100
|
#211
Tragic
4.9%
Fijians
8.7
/100
|
#212
Tragic
4.9%
Osage
8.6
/100
|
#213
Tragic
4.9%
Immigrants | Africa
8.2
/100
|
#214
Tragic
4.9%
Immigrants | Immigrants
8.0
/100
|
#215
Tragic
4.9%

Demographics Similar to Assyrians/Chaldeans/Syriacs by Unemployment Among Ages 35 to 44 years

In terms of unemployment among ages 35 to 44 years, the demographic groups most similar to Assyrians/Chaldeans/Syriacs are Turkish (4.3%, a difference of 0.020%), Bulgarian (4.3%, a difference of 0.080%), Immigrants from Japan (4.3%, a difference of 0.080%), European (4.3%, a difference of 0.27%), and Immigrants from Pakistan (4.3%, a difference of 0.34%).
DemographicsRating | RankUnemployment Among Ages 35 to 44 years
Immigrants | Bolivia
99.7
/100
|
#20
Exceptional
4.2%
Paraguayans
99.6
/100
|
#21
Exceptional
4.2%
Scandinavians
99.5
/100
|
#22
Exceptional
4.2%
Immigrants | Kuwait
99.5
/100
|
#23
Exceptional
4.3%
Tlingit-Haida
99.5
/100
|
#24
Exceptional
4.3%
Bulgarians
99.3
/100
|
#25
Exceptional
4.3%
Turks
99.3
/100
|
#26
Exceptional
4.3%
Assyrians/Chaldeans/Syriacs
99.3
/100
|
#27
Exceptional
4.3%
Immigrants | Japan
99.3
/100
|
#28
Exceptional
4.3%
Europeans
99.2
/100
|
#29
Exceptional
4.3%
Immigrants | Pakistan
99.2
/100
|
#30
Exceptional
4.3%
Carpatho Rusyns
99.2
/100
|
#31
Exceptional
4.3%
Chinese
99.1
/100
|
#32
Exceptional
4.3%
Immigrants | Sri Lanka
99.1
/100
|
#33
Exceptional
4.3%
Jordanians
99.0
/100
|
#34
Exceptional
4.3%