French American Indian vs Immigrants from Ghana Unemployment Among Women with Children Under 6 years
COMPARE
French American Indian
Immigrants from Ghana
Unemployment Among Women with Children Under 6 years
Unemployment Among Women with Children Under 6 years Comparison
French American Indians
Immigrants from Ghana
9.2%
UNEMPLOYMENT AMONG WOMEN WITH CHILDREN UNDER 6 YEARS
0.0/ 100
METRIC RATING
311th/ 347
METRIC RANK
8.3%
UNEMPLOYMENT AMONG WOMEN WITH CHILDREN UNDER 6 YEARS
0.5/ 100
METRIC RATING
258th/ 347
METRIC RANK
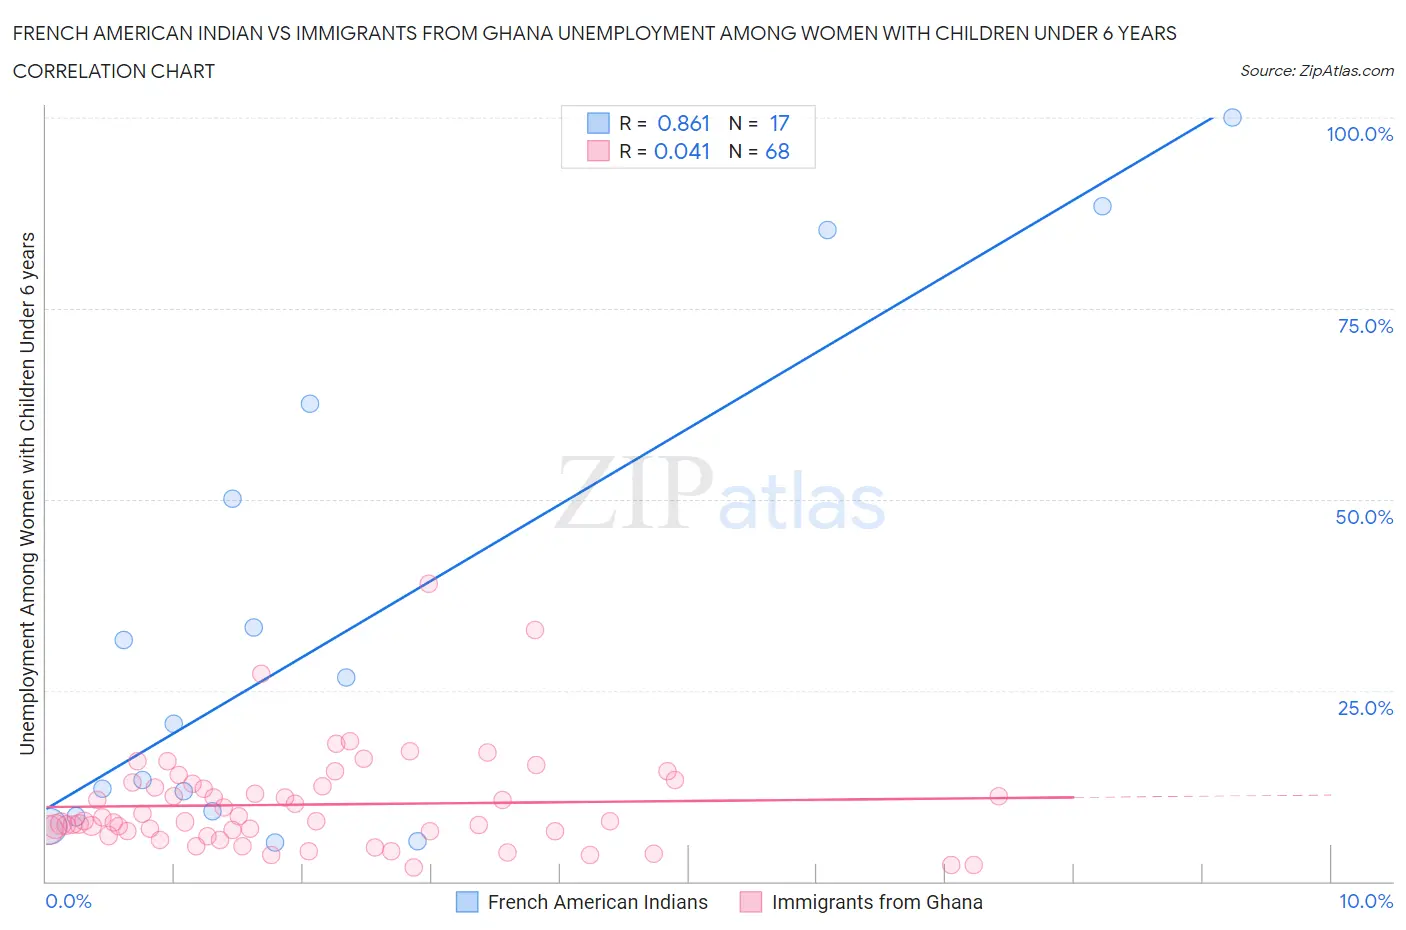
French American Indian vs Immigrants from Ghana Unemployment Among Women with Children Under 6 years Correlation Chart
The statistical analysis conducted on geographies consisting of 112,876,255 people shows a very strong positive correlation between the proportion of French American Indians and unemployment rate among women with children under the age of 6 in the United States with a correlation coefficient (R) of 0.861 and weighted average of 9.2%. Similarly, the statistical analysis conducted on geographies consisting of 171,977,203 people shows no correlation between the proportion of Immigrants from Ghana and unemployment rate among women with children under the age of 6 in the United States with a correlation coefficient (R) of 0.041 and weighted average of 8.3%, a difference of 10.6%.
Unemployment Among Women with Children Under 6 years Correlation Summary
| Measurement | French American Indian | Immigrants from Ghana |
| Minimum | 5.0% | 1.8% |
| Maximum | 100.0% | 39.0% |
| Range | 95.0% | 37.2% |
| Mean | 33.6% | 10.0% |
| Median | 20.5% | 7.9% |
| Interquartile 25% (IQ1) | 8.8% | 6.5% |
| Interquartile 75% (IQ3) | 56.3% | 12.6% |
| Interquartile Range (IQR) | 47.5% | 6.1% |
| Standard Deviation (Sample) | 31.9% | 6.6% |
| Standard Deviation (Population) | 31.0% | 6.5% |
Similar Demographics by Unemployment Among Women with Children Under 6 years
Demographics Similar to French American Indians by Unemployment Among Women with Children Under 6 years
In terms of unemployment among women with children under 6 years, the demographic groups most similar to French American Indians are Immigrants from the Azores (9.2%, a difference of 0.14%), Cajun (9.2%, a difference of 0.28%), African (9.2%, a difference of 0.41%), American (9.3%, a difference of 0.58%), and Fijian (9.3%, a difference of 0.61%).
| Demographics | Rating | Rank | Unemployment Among Women with Children Under 6 years |
| Immigrants | Mexico | 0.0 /100 | #304 | Tragic 9.1% |
| Alaskan Athabascans | 0.0 /100 | #305 | Tragic 9.1% |
| Pueblo | 0.0 /100 | #306 | Tragic 9.1% |
| Dominicans | 0.0 /100 | #307 | Tragic 9.1% |
| Immigrants | Micronesia | 0.0 /100 | #308 | Tragic 9.1% |
| Africans | 0.0 /100 | #309 | Tragic 9.2% |
| Cajuns | 0.0 /100 | #310 | Tragic 9.2% |
| French American Indians | 0.0 /100 | #311 | Tragic 9.2% |
| Immigrants | Azores | 0.0 /100 | #312 | Tragic 9.2% |
| Americans | 0.0 /100 | #313 | Tragic 9.3% |
| Fijians | 0.0 /100 | #314 | Tragic 9.3% |
| Cherokee | 0.0 /100 | #315 | Tragic 9.3% |
| Houma | 0.0 /100 | #316 | Tragic 9.4% |
| Dutch West Indians | 0.0 /100 | #317 | Tragic 9.5% |
| Osage | 0.0 /100 | #318 | Tragic 9.5% |
Demographics Similar to Immigrants from Ghana by Unemployment Among Women with Children Under 6 years
In terms of unemployment among women with children under 6 years, the demographic groups most similar to Immigrants from Ghana are British West Indian (8.3%, a difference of 0.020%), Celtic (8.3%, a difference of 0.28%), Barbadian (8.3%, a difference of 0.29%), Immigrants from Portugal (8.3%, a difference of 0.30%), and White/Caucasian (8.4%, a difference of 0.55%).
| Demographics | Rating | Rank | Unemployment Among Women with Children Under 6 years |
| Guyanese | 1.0 /100 | #251 | Tragic 8.2% |
| Ghanaians | 1.0 /100 | #252 | Tragic 8.2% |
| Immigrants | Guyana | 0.8 /100 | #253 | Tragic 8.2% |
| Immigrants | Caribbean | 0.7 /100 | #254 | Tragic 8.3% |
| Immigrants | Portugal | 0.6 /100 | #255 | Tragic 8.3% |
| Celtics | 0.6 /100 | #256 | Tragic 8.3% |
| British West Indians | 0.5 /100 | #257 | Tragic 8.3% |
| Immigrants | Ghana | 0.5 /100 | #258 | Tragic 8.3% |
| Barbadians | 0.4 /100 | #259 | Tragic 8.3% |
| Whites/Caucasians | 0.3 /100 | #260 | Tragic 8.4% |
| Immigrants | Liberia | 0.3 /100 | #261 | Tragic 8.4% |
| West Indians | 0.3 /100 | #262 | Tragic 8.4% |
| Scotch-Irish | 0.3 /100 | #263 | Tragic 8.4% |
| Hondurans | 0.3 /100 | #264 | Tragic 8.4% |
| French Canadians | 0.3 /100 | #265 | Tragic 8.4% |