French American Indian vs Immigrants from Dominica Unemployment Among Seniors over 65 years
COMPARE
French American Indian
Immigrants from Dominica
Unemployment Among Seniors over 65 years
Unemployment Among Seniors over 65 years Comparison
French American Indians
Immigrants from Dominica
5.3%
UNEMPLOYMENT AMONG SENIORS OVER 65 YEARS
5.2/ 100
METRIC RATING
227th/ 347
METRIC RANK
5.8%
UNEMPLOYMENT AMONG SENIORS OVER 65 YEARS
0.0/ 100
METRIC RATING
323rd/ 347
METRIC RANK
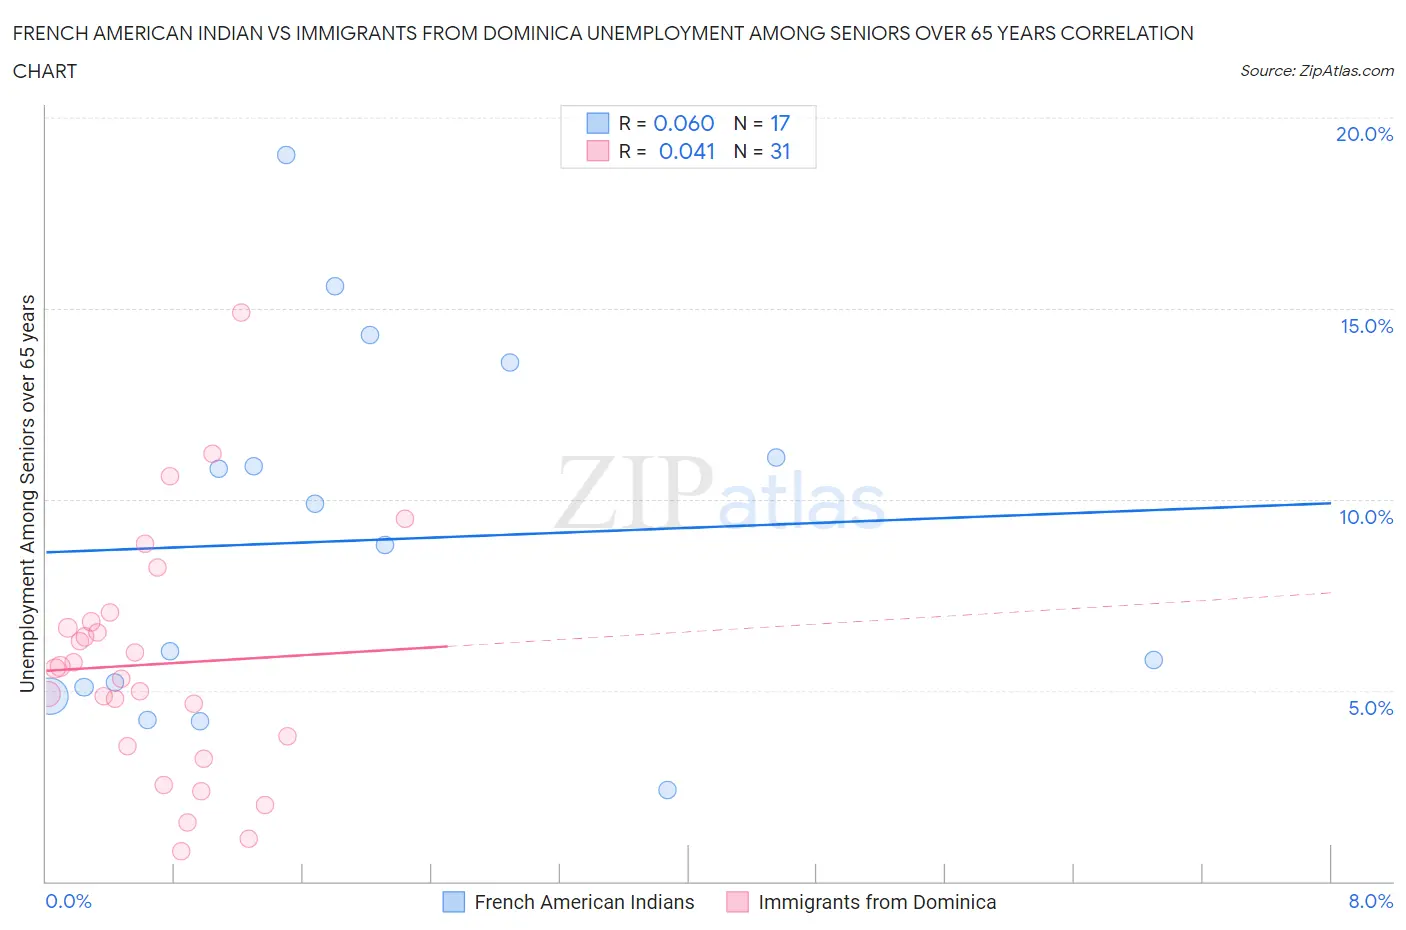
French American Indian vs Immigrants from Dominica Unemployment Among Seniors over 65 years Correlation Chart
The statistical analysis conducted on geographies consisting of 123,804,161 people shows a slight positive correlation between the proportion of French American Indians and unemployment rate amomg seniors over the age of 65 in the United States with a correlation coefficient (R) of 0.060 and weighted average of 5.3%. Similarly, the statistical analysis conducted on geographies consisting of 81,739,326 people shows no correlation between the proportion of Immigrants from Dominica and unemployment rate amomg seniors over the age of 65 in the United States with a correlation coefficient (R) of 0.041 and weighted average of 5.8%, a difference of 9.9%.
Unemployment Among Seniors over 65 years Correlation Summary
| Measurement | French American Indian | Immigrants from Dominica |
| Minimum | 2.4% | 0.80% |
| Maximum | 19.0% | 14.9% |
| Range | 16.6% | 14.1% |
| Mean | 8.9% | 5.7% |
| Median | 8.8% | 5.6% |
| Interquartile 25% (IQ1) | 5.0% | 3.5% |
| Interquartile 75% (IQ3) | 12.3% | 6.8% |
| Interquartile Range (IQR) | 7.4% | 3.3% |
| Standard Deviation (Sample) | 4.8% | 3.1% |
| Standard Deviation (Population) | 4.6% | 3.1% |
Similar Demographics by Unemployment Among Seniors over 65 years
Demographics Similar to French American Indians by Unemployment Among Seniors over 65 years
In terms of unemployment among seniors over 65 years, the demographic groups most similar to French American Indians are Immigrants from Croatia (5.3%, a difference of 0.010%), Immigrants from Syria (5.3%, a difference of 0.060%), Honduran (5.3%, a difference of 0.060%), Cree (5.3%, a difference of 0.080%), and Israeli (5.3%, a difference of 0.14%).
| Demographics | Rating | Rank | Unemployment Among Seniors over 65 years |
| Egyptians | 6.4 /100 | #220 | Tragic 5.3% |
| Arapaho | 6.3 /100 | #221 | Tragic 5.3% |
| Israelis | 6.2 /100 | #222 | Tragic 5.3% |
| Cree | 5.8 /100 | #223 | Tragic 5.3% |
| Immigrants | Syria | 5.6 /100 | #224 | Tragic 5.3% |
| Hondurans | 5.6 /100 | #225 | Tragic 5.3% |
| Immigrants | Croatia | 5.3 /100 | #226 | Tragic 5.3% |
| French American Indians | 5.2 /100 | #227 | Tragic 5.3% |
| Haitians | 4.4 /100 | #228 | Tragic 5.3% |
| Samoans | 4.2 /100 | #229 | Tragic 5.3% |
| Immigrants | Argentina | 4.0 /100 | #230 | Tragic 5.3% |
| Hungarians | 3.9 /100 | #231 | Tragic 5.3% |
| Hopi | 3.5 /100 | #232 | Tragic 5.3% |
| Marshallese | 3.1 /100 | #233 | Tragic 5.3% |
| Blackfeet | 3.1 /100 | #234 | Tragic 5.3% |
Demographics Similar to Immigrants from Dominica by Unemployment Among Seniors over 65 years
In terms of unemployment among seniors over 65 years, the demographic groups most similar to Immigrants from Dominica are Yuman (5.8%, a difference of 0.18%), Native/Alaskan (5.8%, a difference of 0.34%), British West Indian (5.8%, a difference of 0.42%), Inupiat (5.8%, a difference of 0.75%), and Immigrants from Mexico (5.7%, a difference of 1.1%).
| Demographics | Rating | Rank | Unemployment Among Seniors over 65 years |
| Immigrants | Central America | 0.0 /100 | #316 | Tragic 5.7% |
| Immigrants | Bahamas | 0.0 /100 | #317 | Tragic 5.7% |
| Vietnamese | 0.0 /100 | #318 | Tragic 5.7% |
| Immigrants | Bangladesh | 0.0 /100 | #319 | Tragic 5.7% |
| Immigrants | Mexico | 0.0 /100 | #320 | Tragic 5.7% |
| British West Indians | 0.0 /100 | #321 | Tragic 5.8% |
| Natives/Alaskans | 0.0 /100 | #322 | Tragic 5.8% |
| Immigrants | Dominica | 0.0 /100 | #323 | Tragic 5.8% |
| Yuman | 0.0 /100 | #324 | Tragic 5.8% |
| Inupiat | 0.0 /100 | #325 | Tragic 5.8% |
| Shoshone | 0.0 /100 | #326 | Tragic 5.9% |
| Bermudans | 0.0 /100 | #327 | Tragic 5.9% |
| Puerto Ricans | 0.0 /100 | #328 | Tragic 5.9% |
| Dominicans | 0.0 /100 | #329 | Tragic 6.0% |
| Immigrants | Portugal | 0.0 /100 | #330 | Tragic 6.0% |