Finnish vs Immigrants from Peru Unemployment Among Ages 25 to 29 years
COMPARE
Finnish
Immigrants from Peru
Unemployment Among Ages 25 to 29 years
Unemployment Among Ages 25 to 29 years Comparison
Finns
Immigrants from Peru
6.6%
UNEMPLOYMENT AMONG AGES 25 TO 29 YEARS
66.9/ 100
METRIC RATING
150th/ 347
METRIC RANK
6.5%
UNEMPLOYMENT AMONG AGES 25 TO 29 YEARS
79.9/ 100
METRIC RATING
130th/ 347
METRIC RANK
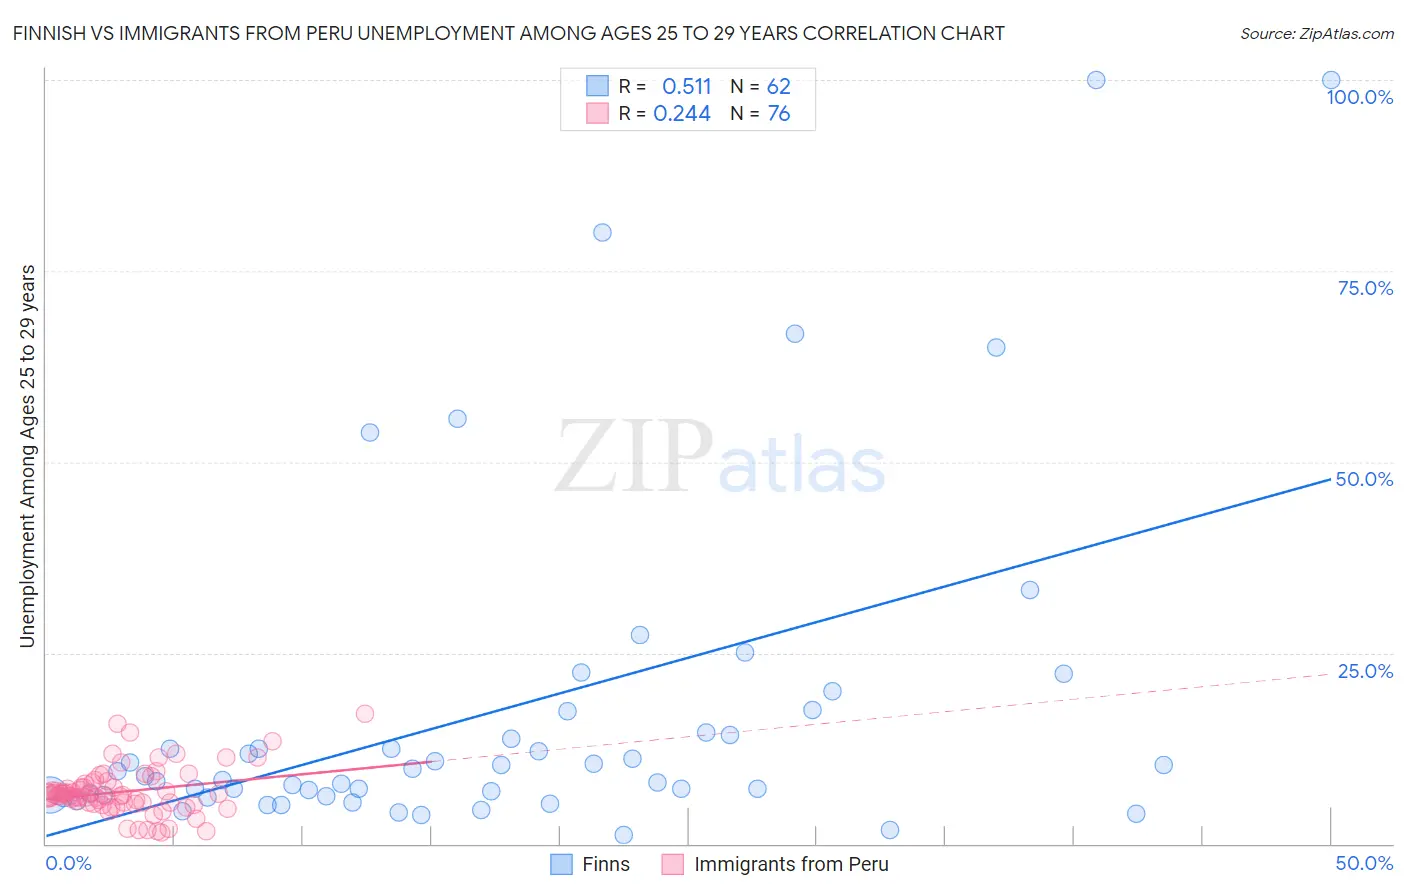
Finnish vs Immigrants from Peru Unemployment Among Ages 25 to 29 years Correlation Chart
The statistical analysis conducted on geographies consisting of 377,937,029 people shows a substantial positive correlation between the proportion of Finns and unemployment rate among population between the ages 25 and 29 in the United States with a correlation coefficient (R) of 0.511 and weighted average of 6.6%. Similarly, the statistical analysis conducted on geographies consisting of 317,774,108 people shows a weak positive correlation between the proportion of Immigrants from Peru and unemployment rate among population between the ages 25 and 29 in the United States with a correlation coefficient (R) of 0.244 and weighted average of 6.5%, a difference of 1.1%.
Unemployment Among Ages 25 to 29 years Correlation Summary
| Measurement | Finnish | Immigrants from Peru |
| Minimum | 1.2% | 1.4% |
| Maximum | 100.0% | 17.0% |
| Range | 98.8% | 15.6% |
| Mean | 17.4% | 6.8% |
| Median | 9.2% | 6.3% |
| Interquartile 25% (IQ1) | 6.3% | 5.3% |
| Interquartile 75% (IQ3) | 14.5% | 8.0% |
| Interquartile Range (IQR) | 8.2% | 2.7% |
| Standard Deviation (Sample) | 22.2% | 3.1% |
| Standard Deviation (Population) | 22.1% | 3.1% |
Demographics Similar to Finns and Immigrants from Peru by Unemployment Among Ages 25 to 29 years
In terms of unemployment among ages 25 to 29 years, the demographic groups most similar to Finns are Malaysian (6.6%, a difference of 0.010%), Peruvian (6.6%, a difference of 0.080%), Immigrants from Thailand (6.6%, a difference of 0.10%), Romanian (6.6%, a difference of 0.18%), and Nicaraguan (6.6%, a difference of 0.23%). Similarly, the demographic groups most similar to Immigrants from Peru are Immigrants from Afghanistan (6.5%, a difference of 0.070%), Polish (6.5%, a difference of 0.31%), Immigrants from Europe (6.5%, a difference of 0.39%), Immigrants from Vietnam (6.5%, a difference of 0.40%), and Immigrants from Croatia (6.5%, a difference of 0.40%).
| Demographics | Rating | Rank | Unemployment Among Ages 25 to 29 years |
| Immigrants | Peru | 79.9 /100 | #130 | Good 6.5% |
| Immigrants | Afghanistan | 79.2 /100 | #131 | Good 6.5% |
| Poles | 76.6 /100 | #132 | Good 6.5% |
| Immigrants | Europe | 75.7 /100 | #133 | Good 6.5% |
| Immigrants | Vietnam | 75.6 /100 | #134 | Good 6.5% |
| Immigrants | Croatia | 75.5 /100 | #135 | Good 6.5% |
| Northern Europeans | 75.4 /100 | #136 | Good 6.5% |
| Eastern Europeans | 74.1 /100 | #137 | Good 6.5% |
| Immigrants | Belgium | 73.8 /100 | #138 | Good 6.5% |
| Austrians | 73.8 /100 | #139 | Good 6.5% |
| Immigrants | Pakistan | 73.8 /100 | #140 | Good 6.5% |
| Maltese | 72.9 /100 | #141 | Good 6.5% |
| Slavs | 72.5 /100 | #142 | Good 6.5% |
| Lithuanians | 72.2 /100 | #143 | Good 6.5% |
| Immigrants | Micronesia | 71.5 /100 | #144 | Good 6.6% |
| Nicaraguans | 70.2 /100 | #145 | Good 6.6% |
| Romanians | 69.5 /100 | #146 | Good 6.6% |
| Immigrants | Thailand | 68.4 /100 | #147 | Good 6.6% |
| Peruvians | 68.1 /100 | #148 | Good 6.6% |
| Malaysians | 67.1 /100 | #149 | Good 6.6% |
| Finns | 66.9 /100 | #150 | Good 6.6% |