Finnish vs Immigrants from Guyana Female Unemployment
COMPARE
Finnish
Immigrants from Guyana
Female Unemployment
Female Unemployment Comparison
Finns
Immigrants from Guyana
4.6%
FEMALE UNEMPLOYMENT
100.0/ 100
METRIC RATING
14th/ 347
METRIC RANK
6.7%
FEMALE UNEMPLOYMENT
0.0/ 100
METRIC RATING
329th/ 347
METRIC RANK
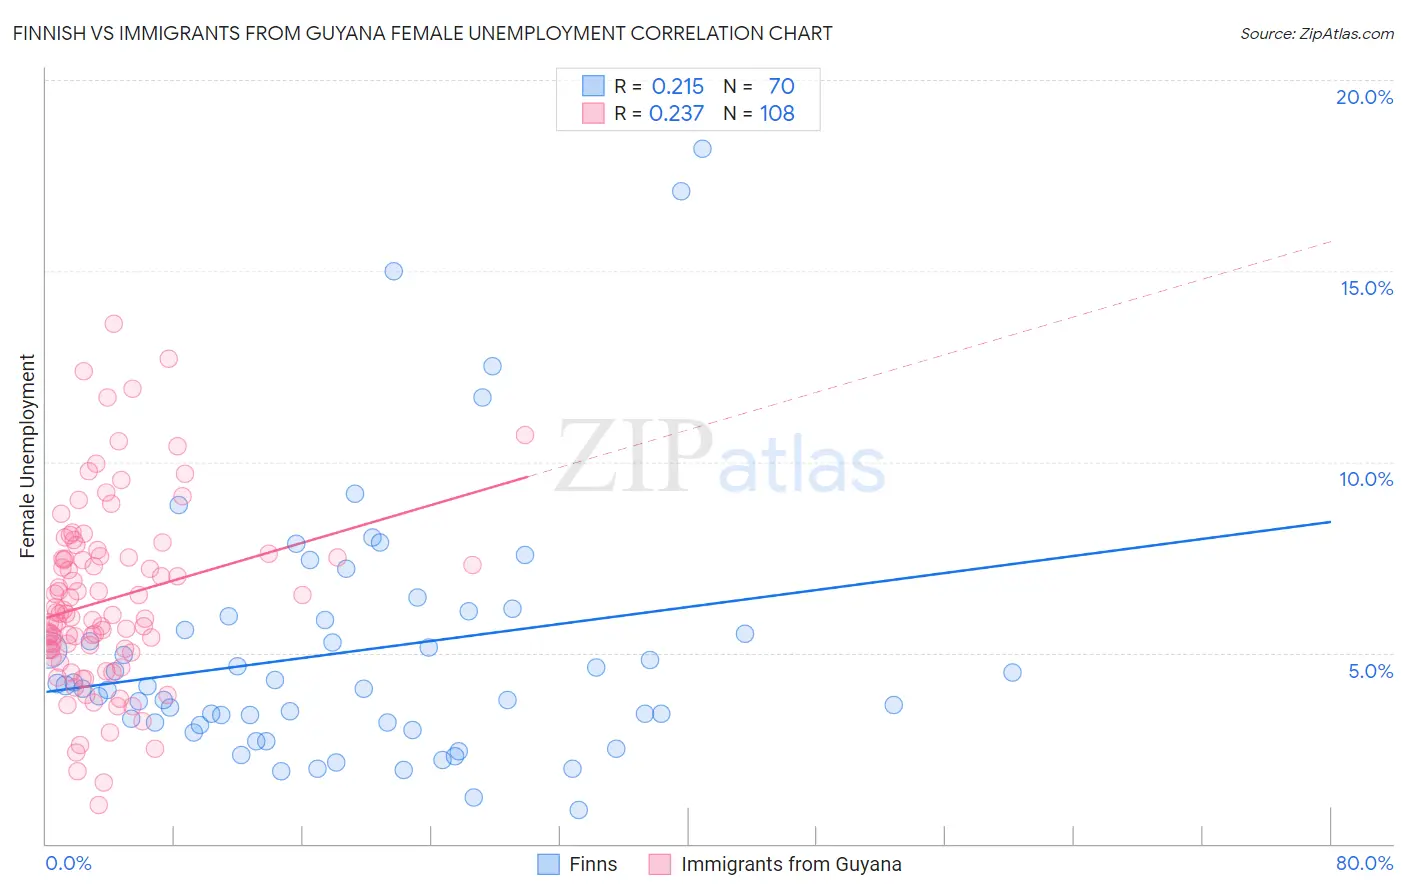
Finnish vs Immigrants from Guyana Female Unemployment Correlation Chart
The statistical analysis conducted on geographies consisting of 401,070,094 people shows a weak positive correlation between the proportion of Finns and unemploymnet rate among females in the United States with a correlation coefficient (R) of 0.215 and weighted average of 4.6%. Similarly, the statistical analysis conducted on geographies consisting of 183,445,412 people shows a weak positive correlation between the proportion of Immigrants from Guyana and unemploymnet rate among females in the United States with a correlation coefficient (R) of 0.237 and weighted average of 6.7%, a difference of 44.5%.
Female Unemployment Correlation Summary
| Measurement | Finnish | Immigrants from Guyana |
| Minimum | 0.90% | 1.0% |
| Maximum | 18.2% | 13.6% |
| Range | 17.3% | 12.6% |
| Mean | 5.0% | 6.4% |
| Median | 4.1% | 6.0% |
| Interquartile 25% (IQ1) | 3.2% | 5.1% |
| Interquartile 75% (IQ3) | 5.9% | 7.5% |
| Interquartile Range (IQR) | 2.7% | 2.4% |
| Standard Deviation (Sample) | 3.4% | 2.4% |
| Standard Deviation (Population) | 3.3% | 2.4% |
Similar Demographics by Female Unemployment
Demographics Similar to Finns by Female Unemployment
In terms of female unemployment, the demographic groups most similar to Finns are English (4.6%, a difference of 0.20%), Belgian (4.6%, a difference of 0.59%), Dutch (4.6%, a difference of 0.75%), Carpatho Rusyn (4.7%, a difference of 1.1%), and Croatian (4.7%, a difference of 1.1%).
| Demographics | Rating | Rank | Female Unemployment |
| Chinese | 100.0 /100 | #7 | Exceptional 4.5% |
| Germans | 100.0 /100 | #8 | Exceptional 4.5% |
| Slovenes | 100.0 /100 | #9 | Exceptional 4.5% |
| Swiss | 100.0 /100 | #10 | Exceptional 4.6% |
| Scandinavians | 100.0 /100 | #11 | Exceptional 4.6% |
| Dutch | 100.0 /100 | #12 | Exceptional 4.6% |
| Belgians | 100.0 /100 | #13 | Exceptional 4.6% |
| Finns | 100.0 /100 | #14 | Exceptional 4.6% |
| English | 100.0 /100 | #15 | Exceptional 4.6% |
| Carpatho Rusyns | 99.9 /100 | #16 | Exceptional 4.7% |
| Croatians | 99.9 /100 | #17 | Exceptional 4.7% |
| Latvians | 99.9 /100 | #18 | Exceptional 4.7% |
| Poles | 99.9 /100 | #19 | Exceptional 4.7% |
| Bulgarians | 99.9 /100 | #20 | Exceptional 4.7% |
| Fijians | 99.9 /100 | #21 | Exceptional 4.7% |
Demographics Similar to Immigrants from Guyana by Female Unemployment
In terms of female unemployment, the demographic groups most similar to Immigrants from Guyana are Guyanese (6.7%, a difference of 0.37%), Yakama (6.7%, a difference of 0.57%), Alaska Native (6.6%, a difference of 0.80%), Native/Alaskan (6.6%, a difference of 0.89%), and Apache (6.6%, a difference of 1.5%).
| Demographics | Rating | Rank | Female Unemployment |
| Vietnamese | 0.0 /100 | #322 | Tragic 6.5% |
| Immigrants | Belize | 0.0 /100 | #323 | Tragic 6.5% |
| Cheyenne | 0.0 /100 | #324 | Tragic 6.6% |
| Apache | 0.0 /100 | #325 | Tragic 6.6% |
| Natives/Alaskans | 0.0 /100 | #326 | Tragic 6.6% |
| Alaska Natives | 0.0 /100 | #327 | Tragic 6.6% |
| Guyanese | 0.0 /100 | #328 | Tragic 6.7% |
| Immigrants | Guyana | 0.0 /100 | #329 | Tragic 6.7% |
| Yakama | 0.0 /100 | #330 | Tragic 6.7% |
| Paiute | 0.0 /100 | #331 | Tragic 6.8% |
| Sioux | 0.0 /100 | #332 | Tragic 7.0% |
| Menominee | 0.0 /100 | #333 | Tragic 7.0% |
| Immigrants | Armenia | 0.0 /100 | #334 | Tragic 7.1% |
| Dominicans | 0.0 /100 | #335 | Tragic 7.2% |
| Immigrants | Dominican Republic | 0.0 /100 | #336 | Tragic 7.2% |