Finnish vs Immigrants from Cabo Verde Unemployment Among Ages 55 to 59 years
COMPARE
Finnish
Immigrants from Cabo Verde
Unemployment Among Ages 55 to 59 years
Unemployment Among Ages 55 to 59 years Comparison
Finns
Immigrants from Cabo Verde
4.6%
UNEMPLOYMENT AMONG AGES 55 TO 59 YEARS
98.2/ 100
METRIC RATING
78th/ 347
METRIC RANK
5.5%
UNEMPLOYMENT AMONG AGES 55 TO 59 YEARS
0.0/ 100
METRIC RATING
306th/ 347
METRIC RANK
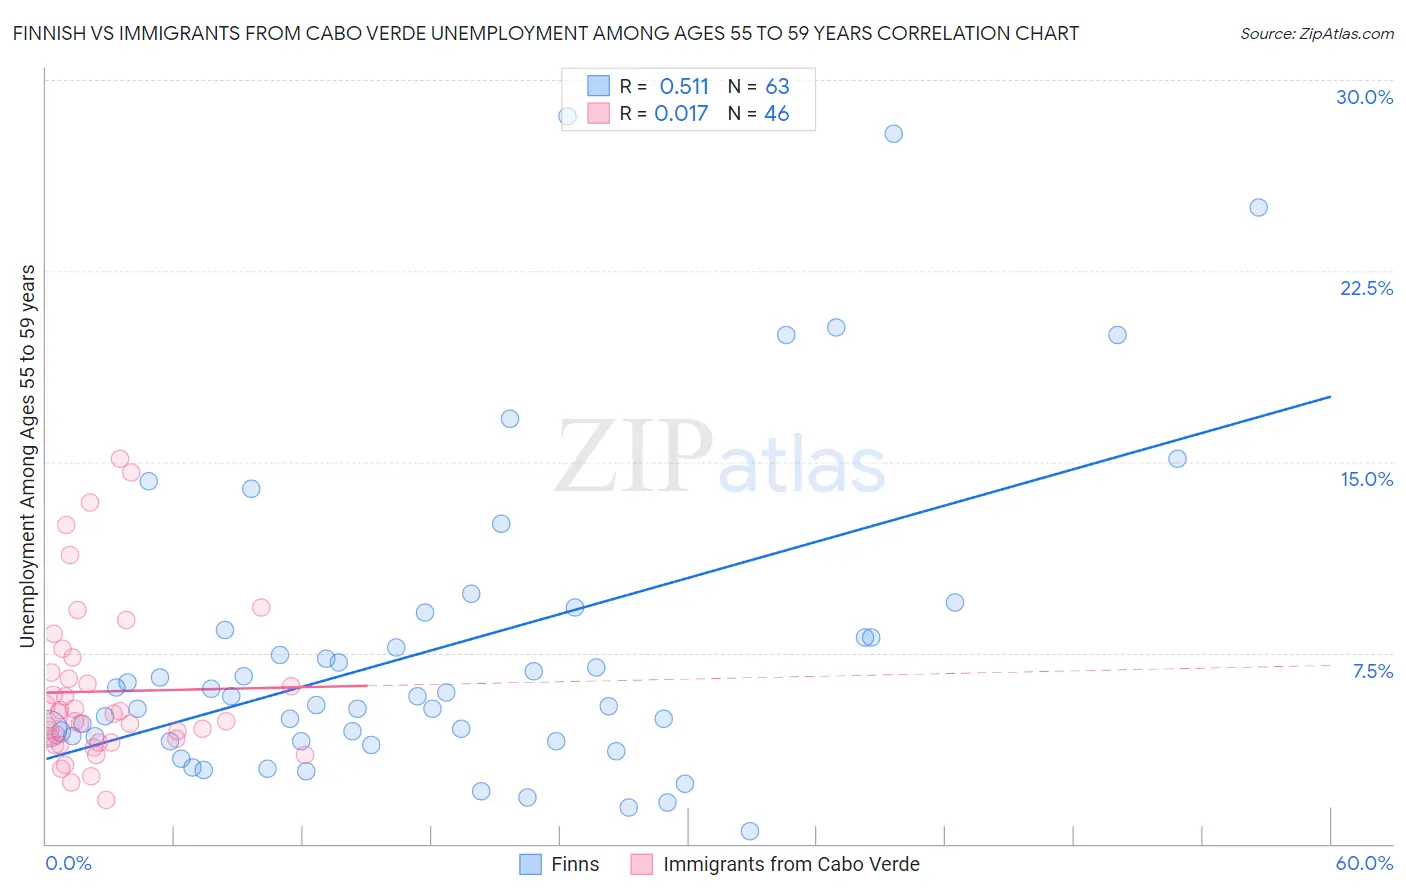
Finnish vs Immigrants from Cabo Verde Unemployment Among Ages 55 to 59 years Correlation Chart
The statistical analysis conducted on geographies consisting of 369,968,764 people shows a substantial positive correlation between the proportion of Finns and unemployment rate among population between the ages 55 and 59 in the United States with a correlation coefficient (R) of 0.511 and weighted average of 4.6%. Similarly, the statistical analysis conducted on geographies consisting of 37,450,207 people shows no correlation between the proportion of Immigrants from Cabo Verde and unemployment rate among population between the ages 55 and 59 in the United States with a correlation coefficient (R) of 0.017 and weighted average of 5.5%, a difference of 19.4%.
Unemployment Among Ages 55 to 59 years Correlation Summary
| Measurement | Finnish | Immigrants from Cabo Verde |
| Minimum | 0.50% | 1.7% |
| Maximum | 28.6% | 15.1% |
| Range | 28.1% | 13.4% |
| Mean | 7.7% | 6.0% |
| Median | 5.8% | 5.0% |
| Interquartile 25% (IQ1) | 4.0% | 4.0% |
| Interquartile 75% (IQ3) | 8.4% | 6.7% |
| Interquartile Range (IQR) | 4.4% | 2.7% |
| Standard Deviation (Sample) | 6.2% | 3.1% |
| Standard Deviation (Population) | 6.2% | 3.1% |
Similar Demographics by Unemployment Among Ages 55 to 59 years
Demographics Similar to Finns by Unemployment Among Ages 55 to 59 years
In terms of unemployment among ages 55 to 59 years, the demographic groups most similar to Finns are Scotch-Irish (4.6%, a difference of 0.050%), Immigrants from Bosnia and Herzegovina (4.6%, a difference of 0.060%), Sri Lankan (4.6%, a difference of 0.090%), Immigrants from Iraq (4.6%, a difference of 0.13%), and Cambodian (4.6%, a difference of 0.13%).
| Demographics | Rating | Rank | Unemployment Among Ages 55 to 59 years |
| Immigrants | Jordan | 98.7 /100 | #71 | Exceptional 4.6% |
| Immigrants | Taiwan | 98.7 /100 | #72 | Exceptional 4.6% |
| Bhutanese | 98.6 /100 | #73 | Exceptional 4.6% |
| Croatians | 98.5 /100 | #74 | Exceptional 4.6% |
| Immigrants | Iraq | 98.5 /100 | #75 | Exceptional 4.6% |
| Immigrants | Bosnia and Herzegovina | 98.3 /100 | #76 | Exceptional 4.6% |
| Scotch-Irish | 98.3 /100 | #77 | Exceptional 4.6% |
| Finns | 98.2 /100 | #78 | Exceptional 4.6% |
| Sri Lankans | 98.1 /100 | #79 | Exceptional 4.6% |
| Cambodians | 98.0 /100 | #80 | Exceptional 4.6% |
| Taiwanese | 97.9 /100 | #81 | Exceptional 4.6% |
| Latvians | 97.8 /100 | #82 | Exceptional 4.6% |
| Lebanese | 97.5 /100 | #83 | Exceptional 4.6% |
| Malaysians | 96.9 /100 | #84 | Exceptional 4.7% |
| Immigrants | Vietnam | 96.9 /100 | #85 | Exceptional 4.7% |
Demographics Similar to Immigrants from Cabo Verde by Unemployment Among Ages 55 to 59 years
In terms of unemployment among ages 55 to 59 years, the demographic groups most similar to Immigrants from Cabo Verde are Immigrants from Portugal (5.5%, a difference of 0.12%), Immigrants from Belize (5.5%, a difference of 0.22%), Black/African American (5.5%, a difference of 0.29%), Spanish American Indian (5.6%, a difference of 0.72%), and Marshallese (5.5%, a difference of 0.81%).
| Demographics | Rating | Rank | Unemployment Among Ages 55 to 59 years |
| Cape Verdeans | 0.0 /100 | #299 | Tragic 5.4% |
| Immigrants | St. Vincent and the Grenadines | 0.0 /100 | #300 | Tragic 5.4% |
| Immigrants | Dominica | 0.0 /100 | #301 | Tragic 5.5% |
| Sierra Leoneans | 0.0 /100 | #302 | Tragic 5.5% |
| Marshallese | 0.0 /100 | #303 | Tragic 5.5% |
| Blacks/African Americans | 0.0 /100 | #304 | Tragic 5.5% |
| Immigrants | Portugal | 0.0 /100 | #305 | Tragic 5.5% |
| Immigrants | Cabo Verde | 0.0 /100 | #306 | Tragic 5.5% |
| Immigrants | Belize | 0.0 /100 | #307 | Tragic 5.5% |
| Spanish American Indians | 0.0 /100 | #308 | Tragic 5.6% |
| Nepalese | 0.0 /100 | #309 | Tragic 5.6% |
| Belizeans | 0.0 /100 | #310 | Tragic 5.6% |
| Houma | 0.0 /100 | #311 | Tragic 5.6% |
| Ecuadorians | 0.0 /100 | #312 | Tragic 5.6% |
| Central American Indians | 0.0 /100 | #313 | Tragic 5.6% |