Finnish vs Assyrian/Chaldean/Syriac Unemployment Among Seniors over 65 years
COMPARE
Finnish
Assyrian/Chaldean/Syriac
Unemployment Among Seniors over 65 years
Unemployment Among Seniors over 65 years Comparison
Finns
Assyrians/Chaldeans/Syriacs
5.0%
UNEMPLOYMENT AMONG SENIORS OVER 65 YEARS
92.2/ 100
METRIC RATING
111th/ 347
METRIC RANK
5.0%
UNEMPLOYMENT AMONG SENIORS OVER 65 YEARS
96.8/ 100
METRIC RATING
95th/ 347
METRIC RANK
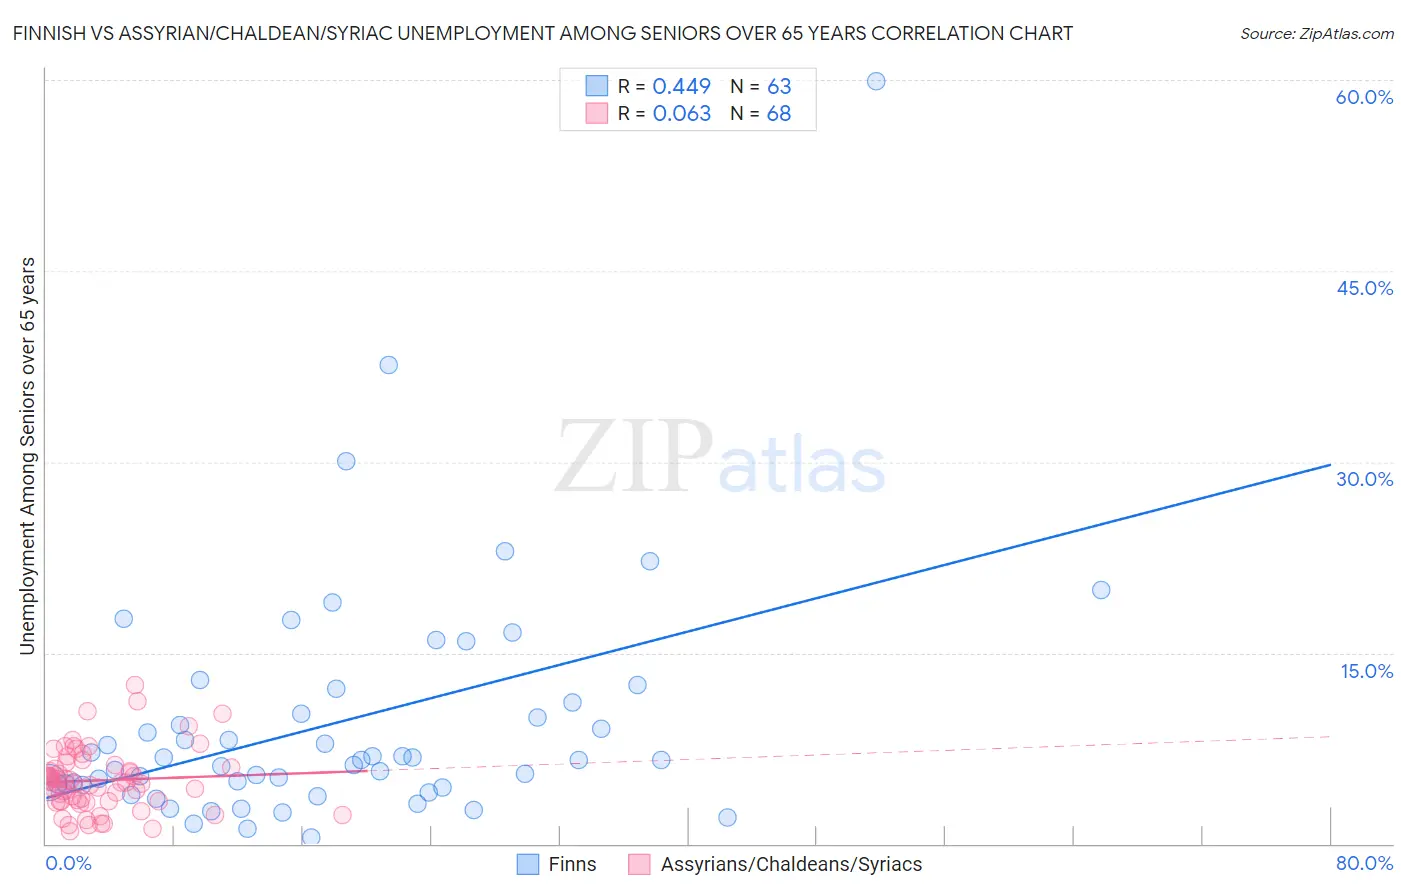
Finnish vs Assyrian/Chaldean/Syriac Unemployment Among Seniors over 65 years Correlation Chart
The statistical analysis conducted on geographies consisting of 356,249,790 people shows a moderate positive correlation between the proportion of Finns and unemployment rate amomg seniors over the age of 65 in the United States with a correlation coefficient (R) of 0.449 and weighted average of 5.0%. Similarly, the statistical analysis conducted on geographies consisting of 107,075,220 people shows a slight positive correlation between the proportion of Assyrians/Chaldeans/Syriacs and unemployment rate amomg seniors over the age of 65 in the United States with a correlation coefficient (R) of 0.063 and weighted average of 5.0%, a difference of 0.77%.
Unemployment Among Seniors over 65 years Correlation Summary
| Measurement | Finnish | Assyrian/Chaldean/Syriac |
| Minimum | 0.50% | 1.0% |
| Maximum | 59.9% | 12.5% |
| Range | 59.4% | 11.5% |
| Mean | 9.5% | 5.0% |
| Median | 6.6% | 4.8% |
| Interquartile 25% (IQ1) | 4.6% | 3.4% |
| Interquartile 75% (IQ3) | 11.1% | 6.1% |
| Interquartile Range (IQR) | 6.5% | 2.7% |
| Standard Deviation (Sample) | 9.5% | 2.4% |
| Standard Deviation (Population) | 9.5% | 2.4% |
Demographics Similar to Finns and Assyrians/Chaldeans/Syriacs by Unemployment Among Seniors over 65 years
In terms of unemployment among seniors over 65 years, the demographic groups most similar to Finns are Eastern European (5.0%, a difference of 0.020%), Immigrants from Saudi Arabia (5.0%, a difference of 0.060%), Immigrants from Malaysia (5.0%, a difference of 0.070%), Seminole (5.0%, a difference of 0.080%), and Immigrants from Vietnam (5.0%, a difference of 0.090%). Similarly, the demographic groups most similar to Assyrians/Chaldeans/Syriacs are Immigrants from Singapore (5.0%, a difference of 0.0%), Burmese (5.0%, a difference of 0.010%), Immigrants from Oceania (5.0%, a difference of 0.010%), Czechoslovakian (5.0%, a difference of 0.010%), and South African (5.0%, a difference of 0.070%).
| Demographics | Rating | Rank | Unemployment Among Seniors over 65 years |
| Austrians | 97.3 /100 | #93 | Exceptional 5.0% |
| Burmese | 96.8 /100 | #94 | Exceptional 5.0% |
| Assyrians/Chaldeans/Syriacs | 96.8 /100 | #95 | Exceptional 5.0% |
| Immigrants | Singapore | 96.8 /100 | #96 | Exceptional 5.0% |
| Immigrants | Oceania | 96.8 /100 | #97 | Exceptional 5.0% |
| Czechoslovakians | 96.7 /100 | #98 | Exceptional 5.0% |
| South Africans | 96.5 /100 | #99 | Exceptional 5.0% |
| Romanians | 95.5 /100 | #100 | Exceptional 5.0% |
| Yugoslavians | 95.4 /100 | #101 | Exceptional 5.0% |
| Immigrants | Thailand | 95.4 /100 | #102 | Exceptional 5.0% |
| Immigrants | Lithuania | 95.1 /100 | #103 | Exceptional 5.0% |
| Immigrants | Scotland | 95.0 /100 | #104 | Exceptional 5.0% |
| Okinawans | 94.7 /100 | #105 | Exceptional 5.0% |
| Immigrants | Turkey | 94.3 /100 | #106 | Exceptional 5.0% |
| Immigrants | Germany | 93.2 /100 | #107 | Exceptional 5.0% |
| Immigrants | Vietnam | 92.9 /100 | #108 | Exceptional 5.0% |
| Immigrants | Malaysia | 92.7 /100 | #109 | Exceptional 5.0% |
| Immigrants | Saudi Arabia | 92.7 /100 | #110 | Exceptional 5.0% |
| Finns | 92.2 /100 | #111 | Exceptional 5.0% |
| Eastern Europeans | 92.0 /100 | #112 | Exceptional 5.0% |
| Seminole | 91.4 /100 | #113 | Exceptional 5.0% |