Filipino vs Polish Unemployment Among Ages 25 to 29 years
COMPARE
Filipino
Polish
Unemployment Among Ages 25 to 29 years
Unemployment Among Ages 25 to 29 years Comparison
Filipinos
Poles
6.1%
UNEMPLOYMENT AMONG AGES 25 TO 29 YEARS
99.7/ 100
METRIC RATING
31st/ 347
METRIC RANK
6.5%
UNEMPLOYMENT AMONG AGES 25 TO 29 YEARS
76.6/ 100
METRIC RATING
132nd/ 347
METRIC RANK
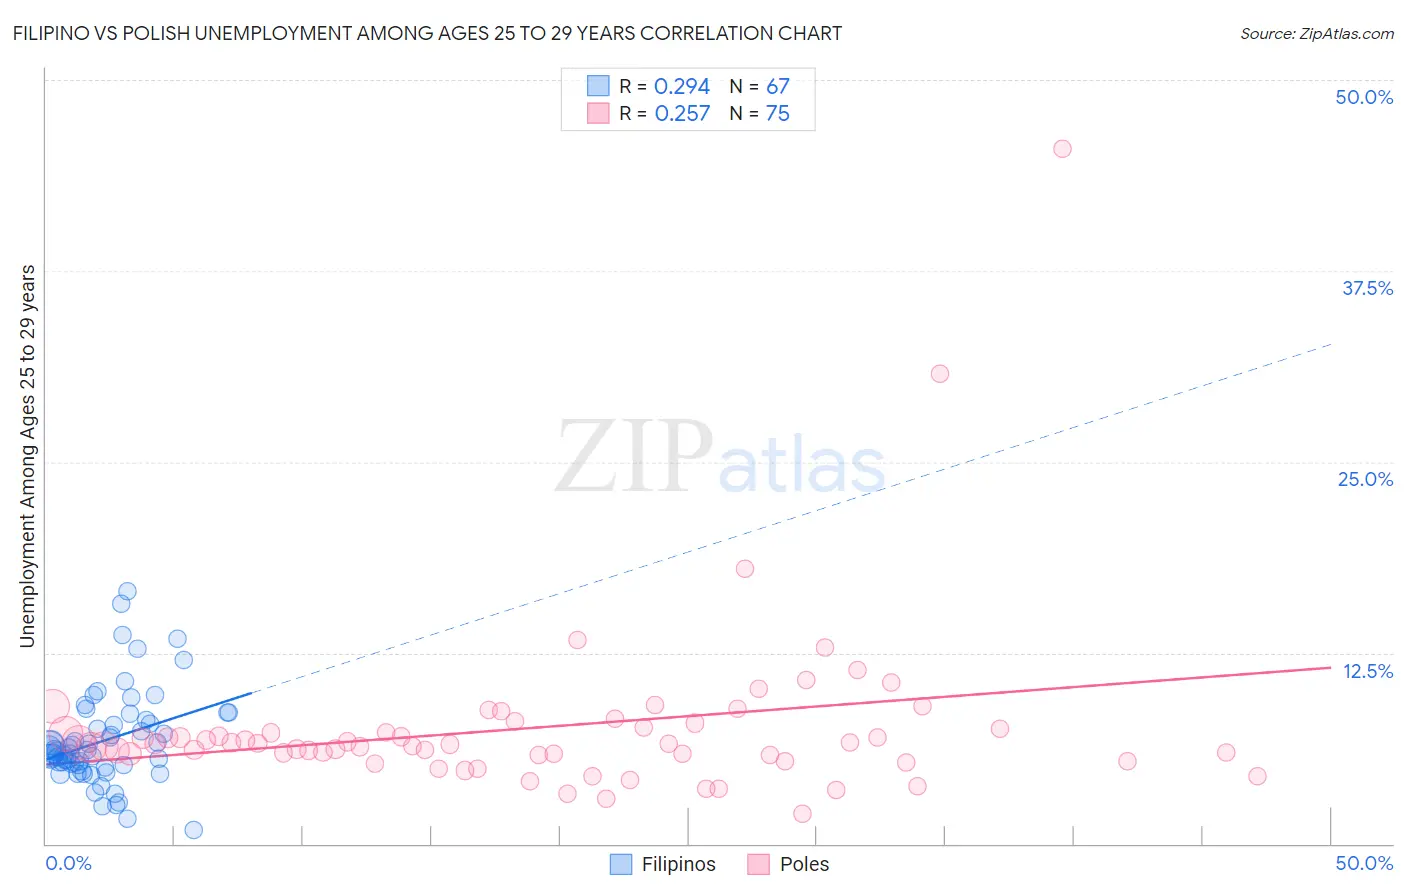
Filipino vs Polish Unemployment Among Ages 25 to 29 years Correlation Chart
The statistical analysis conducted on geographies consisting of 247,082,146 people shows a weak positive correlation between the proportion of Filipinos and unemployment rate among population between the ages 25 and 29 in the United States with a correlation coefficient (R) of 0.294 and weighted average of 6.1%. Similarly, the statistical analysis conducted on geographies consisting of 499,723,936 people shows a weak positive correlation between the proportion of Poles and unemployment rate among population between the ages 25 and 29 in the United States with a correlation coefficient (R) of 0.257 and weighted average of 6.5%, a difference of 7.6%.
Unemployment Among Ages 25 to 29 years Correlation Summary
| Measurement | Filipino | Polish |
| Minimum | 0.90% | 2.0% |
| Maximum | 16.5% | 45.5% |
| Range | 15.6% | 43.5% |
| Mean | 6.8% | 7.6% |
| Median | 6.1% | 6.5% |
| Interquartile 25% (IQ1) | 5.2% | 5.8% |
| Interquartile 75% (IQ3) | 8.1% | 7.6% |
| Interquartile Range (IQR) | 2.9% | 1.9% |
| Standard Deviation (Sample) | 3.1% | 5.8% |
| Standard Deviation (Population) | 3.0% | 5.7% |
Similar Demographics by Unemployment Among Ages 25 to 29 years
Demographics Similar to Filipinos by Unemployment Among Ages 25 to 29 years
In terms of unemployment among ages 25 to 29 years, the demographic groups most similar to Filipinos are Bulgarian (6.1%, a difference of 0.090%), Immigrants from South Central Asia (6.1%, a difference of 0.20%), Chinese (6.1%, a difference of 0.35%), Danish (6.0%, a difference of 0.38%), and Immigrants from Zaire (6.0%, a difference of 0.43%).
| Demographics | Rating | Rank | Unemployment Among Ages 25 to 29 years |
| Norwegians | 99.8 /100 | #24 | Exceptional 6.0% |
| New Zealanders | 99.8 /100 | #25 | Exceptional 6.0% |
| Immigrants | Eastern Africa | 99.8 /100 | #26 | Exceptional 6.0% |
| Immigrants | Zaire | 99.7 /100 | #27 | Exceptional 6.0% |
| Danes | 99.7 /100 | #28 | Exceptional 6.0% |
| Immigrants | South Central Asia | 99.7 /100 | #29 | Exceptional 6.1% |
| Bulgarians | 99.7 /100 | #30 | Exceptional 6.1% |
| Filipinos | 99.7 /100 | #31 | Exceptional 6.1% |
| Chinese | 99.6 /100 | #32 | Exceptional 6.1% |
| Yugoslavians | 99.6 /100 | #33 | Exceptional 6.1% |
| Immigrants | Morocco | 99.5 /100 | #34 | Exceptional 6.1% |
| Immigrants | Zimbabwe | 99.5 /100 | #35 | Exceptional 6.1% |
| Taiwanese | 99.5 /100 | #36 | Exceptional 6.1% |
| Immigrants | Serbia | 99.5 /100 | #37 | Exceptional 6.1% |
| Ethiopians | 99.4 /100 | #38 | Exceptional 6.1% |
Demographics Similar to Poles by Unemployment Among Ages 25 to 29 years
In terms of unemployment among ages 25 to 29 years, the demographic groups most similar to Poles are Immigrants from Europe (6.5%, a difference of 0.080%), Immigrants from Vietnam (6.5%, a difference of 0.090%), Immigrants from Croatia (6.5%, a difference of 0.090%), Northern European (6.5%, a difference of 0.11%), and Eastern European (6.5%, a difference of 0.22%).
| Demographics | Rating | Rank | Unemployment Among Ages 25 to 29 years |
| Syrians | 82.1 /100 | #125 | Excellent 6.5% |
| Brazilians | 81.9 /100 | #126 | Excellent 6.5% |
| Dutch | 80.6 /100 | #127 | Excellent 6.5% |
| Immigrants | Chile | 80.5 /100 | #128 | Excellent 6.5% |
| Sri Lankans | 80.3 /100 | #129 | Excellent 6.5% |
| Immigrants | Peru | 79.9 /100 | #130 | Good 6.5% |
| Immigrants | Afghanistan | 79.2 /100 | #131 | Good 6.5% |
| Poles | 76.6 /100 | #132 | Good 6.5% |
| Immigrants | Europe | 75.7 /100 | #133 | Good 6.5% |
| Immigrants | Vietnam | 75.6 /100 | #134 | Good 6.5% |
| Immigrants | Croatia | 75.5 /100 | #135 | Good 6.5% |
| Northern Europeans | 75.4 /100 | #136 | Good 6.5% |
| Eastern Europeans | 74.1 /100 | #137 | Good 6.5% |
| Immigrants | Belgium | 73.8 /100 | #138 | Good 6.5% |
| Austrians | 73.8 /100 | #139 | Good 6.5% |