Filipino vs Cambodian Unemployment Among Youth under 25 years
COMPARE
Filipino
Cambodian
Unemployment Among Youth under 25 years
Unemployment Among Youth under 25 years Comparison
Filipinos
Cambodians
11.1%
UNEMPLOYMENT AMONG YOUTH UNDER 25 YEARS
98.3/ 100
METRIC RATING
61st/ 347
METRIC RANK
10.9%
UNEMPLOYMENT AMONG YOUTH UNDER 25 YEARS
99.7/ 100
METRIC RATING
42nd/ 347
METRIC RANK
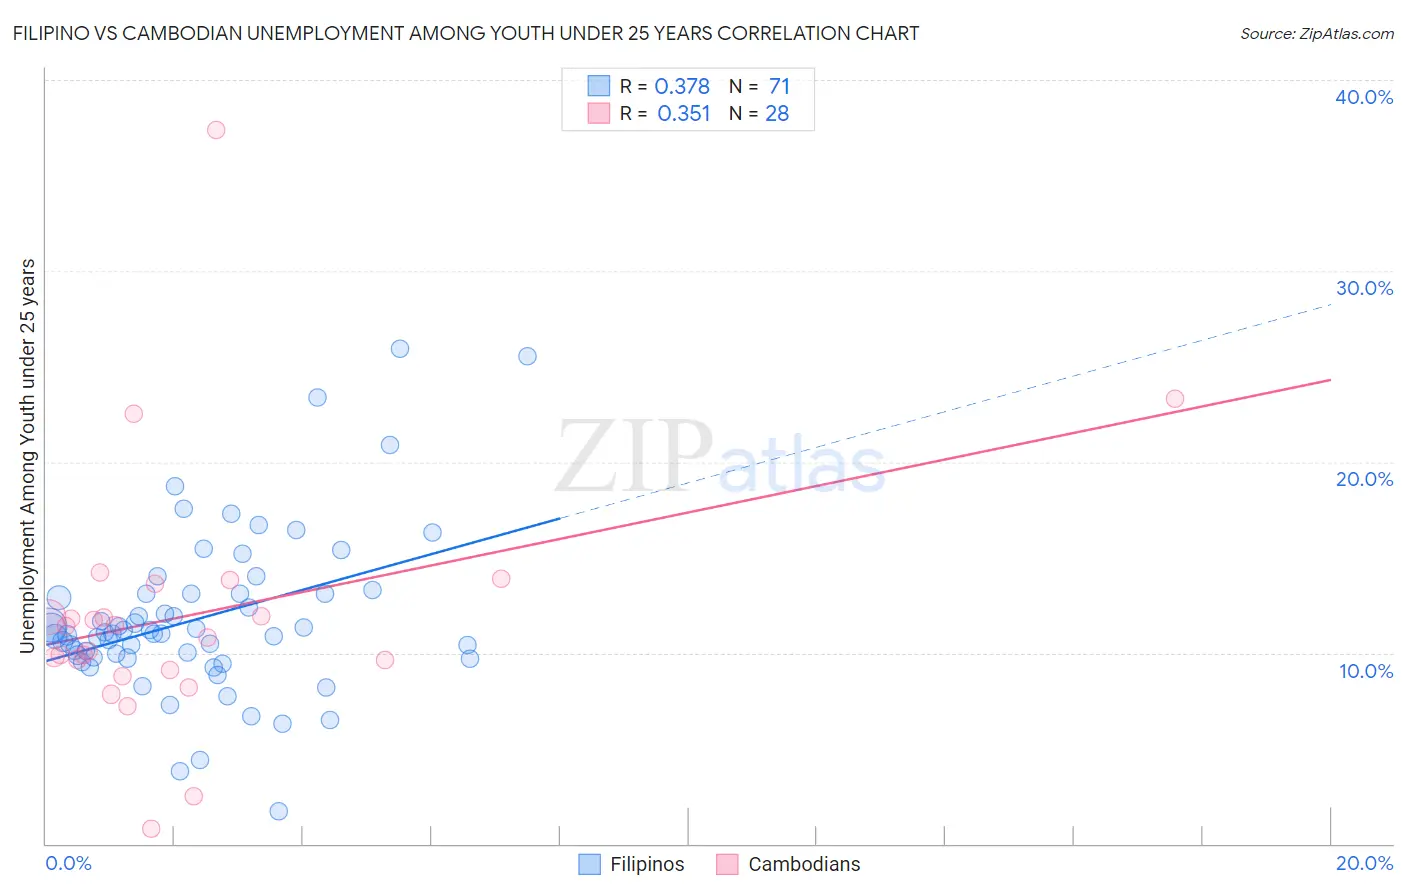
Filipino vs Cambodian Unemployment Among Youth under 25 years Correlation Chart
The statistical analysis conducted on geographies consisting of 253,048,092 people shows a mild positive correlation between the proportion of Filipinos and unemployment rate among youth under the age of 25 in the United States with a correlation coefficient (R) of 0.378 and weighted average of 11.1%. Similarly, the statistical analysis conducted on geographies consisting of 102,245,737 people shows a mild positive correlation between the proportion of Cambodians and unemployment rate among youth under the age of 25 in the United States with a correlation coefficient (R) of 0.351 and weighted average of 10.9%, a difference of 2.1%.
Unemployment Among Youth under 25 years Correlation Summary
| Measurement | Filipino | Cambodian |
| Minimum | 1.7% | 0.80% |
| Maximum | 25.9% | 37.4% |
| Range | 24.2% | 36.6% |
| Mean | 11.8% | 12.0% |
| Median | 11.0% | 11.1% |
| Interquartile 25% (IQ1) | 9.8% | 9.3% |
| Interquartile 75% (IQ3) | 13.1% | 12.8% |
| Interquartile Range (IQR) | 3.4% | 3.4% |
| Standard Deviation (Sample) | 4.3% | 6.7% |
| Standard Deviation (Population) | 4.3% | 6.6% |
Demographics Similar to Filipinos and Cambodians by Unemployment Among Youth under 25 years
In terms of unemployment among youth under 25 years, the demographic groups most similar to Filipinos are South African (11.1%, a difference of 0.18%), Immigrants from Eastern Africa (11.1%, a difference of 0.33%), Scotch-Irish (11.1%, a difference of 0.39%), Immigrants from Eritrea (11.1%, a difference of 0.43%), and Immigrants from Saudi Arabia (11.1%, a difference of 0.44%). Similarly, the demographic groups most similar to Cambodians are Croatian (10.9%, a difference of 0.070%), British (10.9%, a difference of 0.26%), Welsh (10.9%, a difference of 0.28%), Bulgarian (10.9%, a difference of 0.38%), and Tongan (10.9%, a difference of 0.42%).
| Demographics | Rating | Rank | Unemployment Among Youth under 25 years |
| Croatians | 99.8 /100 | #41 | Exceptional 10.9% |
| Cambodians | 99.7 /100 | #42 | Exceptional 10.9% |
| British | 99.7 /100 | #43 | Exceptional 10.9% |
| Welsh | 99.7 /100 | #44 | Exceptional 10.9% |
| Bulgarians | 99.6 /100 | #45 | Exceptional 10.9% |
| Tongans | 99.6 /100 | #46 | Exceptional 10.9% |
| Australians | 99.6 /100 | #47 | Exceptional 10.9% |
| Poles | 99.3 /100 | #48 | Exceptional 11.0% |
| Thais | 99.3 /100 | #49 | Exceptional 11.0% |
| Czechoslovakians | 99.2 /100 | #50 | Exceptional 11.0% |
| Serbians | 99.0 /100 | #51 | Exceptional 11.0% |
| Latvians | 99.0 /100 | #52 | Exceptional 11.0% |
| Ottawa | 99.0 /100 | #53 | Exceptional 11.1% |
| Mongolians | 98.9 /100 | #54 | Exceptional 11.1% |
| Irish | 98.9 /100 | #55 | Exceptional 11.1% |
| Immigrants | Saudi Arabia | 98.8 /100 | #56 | Exceptional 11.1% |
| Immigrants | Eritrea | 98.8 /100 | #57 | Exceptional 11.1% |
| Scotch-Irish | 98.8 /100 | #58 | Exceptional 11.1% |
| Immigrants | Eastern Africa | 98.7 /100 | #59 | Exceptional 11.1% |
| South Africans | 98.5 /100 | #60 | Exceptional 11.1% |
| Filipinos | 98.3 /100 | #61 | Exceptional 11.1% |