Fijian vs Immigrants from Cameroon Unemployment Among Seniors over 75 years
COMPARE
Fijian
Immigrants from Cameroon
Unemployment Among Seniors over 75 years
Unemployment Among Seniors over 75 years Comparison
Fijians
Immigrants from Cameroon
8.7%
UNEMPLOYMENT AMONG SENIORS OVER 75 YEARS
56.4/ 100
METRIC RATING
169th/ 347
METRIC RANK
9.3%
UNEMPLOYMENT AMONG SENIORS OVER 75 YEARS
1.0/ 100
METRIC RATING
260th/ 347
METRIC RANK
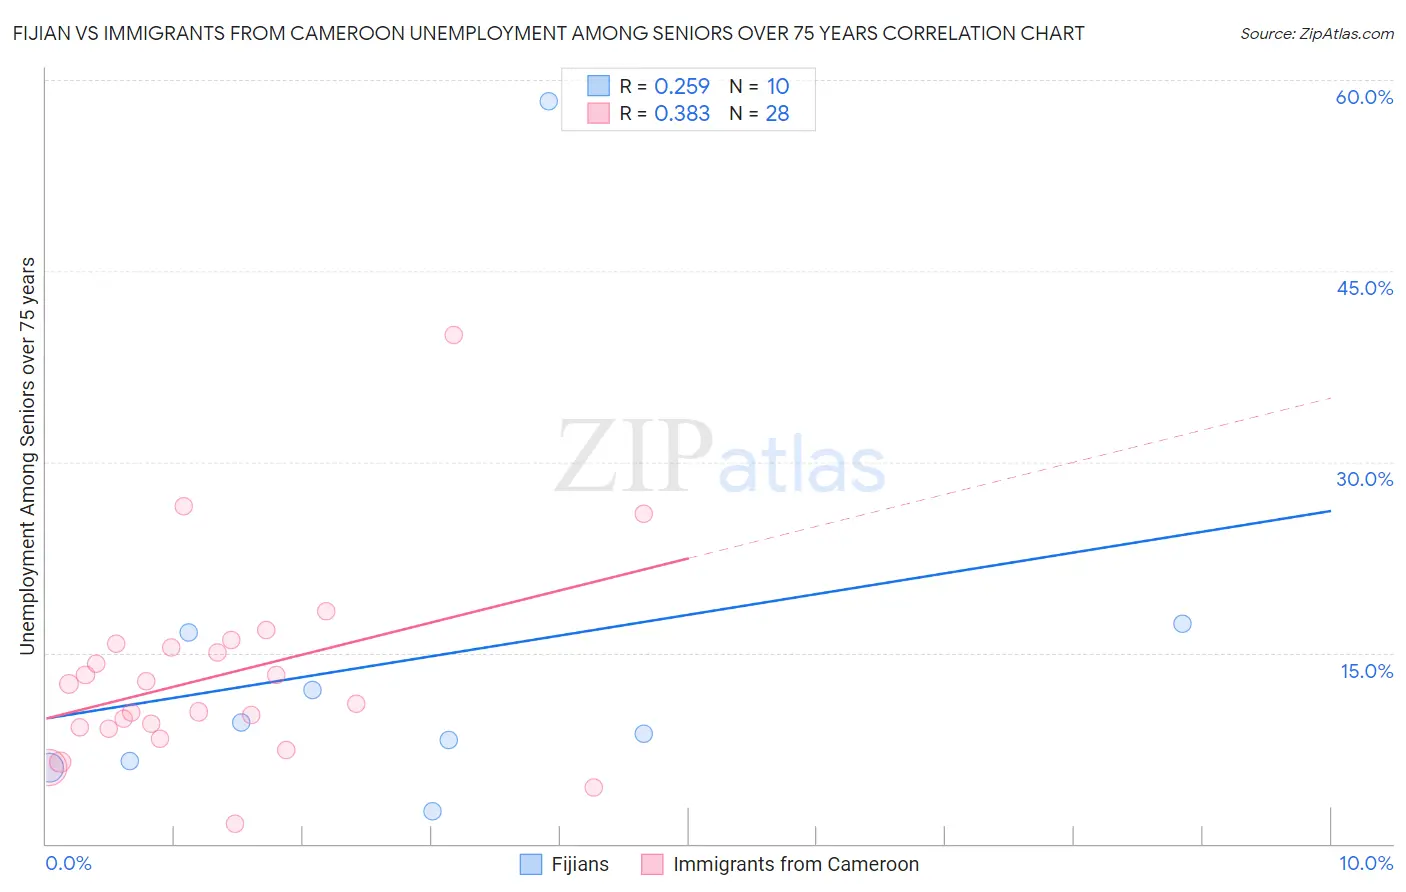
Fijian vs Immigrants from Cameroon Unemployment Among Seniors over 75 years Correlation Chart
The statistical analysis conducted on geographies consisting of 43,656,778 people shows a weak positive correlation between the proportion of Fijians and unemployment rate among seniors over the age of 75 in the United States with a correlation coefficient (R) of 0.259 and weighted average of 8.7%. Similarly, the statistical analysis conducted on geographies consisting of 92,761,505 people shows a mild positive correlation between the proportion of Immigrants from Cameroon and unemployment rate among seniors over the age of 75 in the United States with a correlation coefficient (R) of 0.383 and weighted average of 9.3%, a difference of 6.5%.
Unemployment Among Seniors over 75 years Correlation Summary
| Measurement | Fijian | Immigrants from Cameroon |
| Minimum | 2.6% | 1.6% |
| Maximum | 58.3% | 40.0% |
| Range | 55.7% | 38.4% |
| Mean | 14.6% | 13.2% |
| Median | 9.1% | 11.8% |
| Interquartile 25% (IQ1) | 6.5% | 9.1% |
| Interquartile 75% (IQ3) | 16.6% | 15.6% |
| Interquartile Range (IQR) | 10.2% | 6.5% |
| Standard Deviation (Sample) | 16.0% | 7.6% |
| Standard Deviation (Population) | 15.2% | 7.5% |
Similar Demographics by Unemployment Among Seniors over 75 years
Demographics Similar to Fijians by Unemployment Among Seniors over 75 years
In terms of unemployment among seniors over 75 years, the demographic groups most similar to Fijians are Immigrants from Lithuania (8.7%, a difference of 0.040%), Immigrants from Eastern Africa (8.7%, a difference of 0.060%), Immigrants from Belize (8.7%, a difference of 0.070%), Zimbabwean (8.7%, a difference of 0.13%), and Dominican (8.7%, a difference of 0.25%).
| Demographics | Rating | Rank | Unemployment Among Seniors over 75 years |
| Immigrants | South America | 71.3 /100 | #162 | Good 8.6% |
| Immigrants | Guatemala | 68.4 /100 | #163 | Good 8.7% |
| Paraguayans | 62.2 /100 | #164 | Good 8.7% |
| Immigrants | Dominican Republic | 61.4 /100 | #165 | Good 8.7% |
| Immigrants | Belize | 57.6 /100 | #166 | Average 8.7% |
| Immigrants | Eastern Africa | 57.6 /100 | #167 | Average 8.7% |
| Immigrants | Lithuania | 57.2 /100 | #168 | Average 8.7% |
| Fijians | 56.4 /100 | #169 | Average 8.7% |
| Zimbabweans | 54.1 /100 | #170 | Average 8.7% |
| Dominicans | 51.9 /100 | #171 | Average 8.7% |
| Immigrants | Immigrants | 51.8 /100 | #172 | Average 8.7% |
| Australians | 50.3 /100 | #173 | Average 8.7% |
| Immigrants | El Salvador | 49.7 /100 | #174 | Average 8.7% |
| Syrians | 49.6 /100 | #175 | Average 8.7% |
| Somalis | 45.3 /100 | #176 | Average 8.8% |
Demographics Similar to Immigrants from Cameroon by Unemployment Among Seniors over 75 years
In terms of unemployment among seniors over 75 years, the demographic groups most similar to Immigrants from Cameroon are Slovene (9.3%, a difference of 0.050%), Immigrants from England (9.3%, a difference of 0.060%), Hawaiian (9.3%, a difference of 0.21%), Celtic (9.3%, a difference of 0.26%), and Brazilian (9.3%, a difference of 0.33%).
| Demographics | Rating | Rank | Unemployment Among Seniors over 75 years |
| Pima | 1.8 /100 | #253 | Tragic 9.2% |
| Immigrants | Ghana | 1.7 /100 | #254 | Tragic 9.2% |
| Immigrants | Scotland | 1.4 /100 | #255 | Tragic 9.2% |
| Brazilians | 1.3 /100 | #256 | Tragic 9.3% |
| Hawaiians | 1.2 /100 | #257 | Tragic 9.3% |
| Immigrants | England | 1.0 /100 | #258 | Tragic 9.3% |
| Slovenes | 1.0 /100 | #259 | Tragic 9.3% |
| Immigrants | Cameroon | 1.0 /100 | #260 | Tragic 9.3% |
| Celtics | 0.8 /100 | #261 | Tragic 9.3% |
| Austrians | 0.7 /100 | #262 | Tragic 9.3% |
| Ukrainians | 0.7 /100 | #263 | Tragic 9.3% |
| Iroquois | 0.7 /100 | #264 | Tragic 9.3% |
| Palestinians | 0.6 /100 | #265 | Tragic 9.3% |
| Blacks/African Americans | 0.5 /100 | #266 | Tragic 9.4% |
| Immigrants | Mexico | 0.4 /100 | #267 | Tragic 9.4% |