Fijian vs Greek Unemployment Among Women with Children Under 18 years

COMPARE

Fijian
Race
Ancestry
AfghanAfricanAlaska NativeAlaskan AthabascanAlbanianAleutAlsatianAmericanApacheArabArapahoArgentineanArmenianAssyrian/Chaldean/SyriacAustralianAustrianBahamianBangladeshiBarbadianBasqueBelgianBelizeanBermudanBhutaneseBlackfeetBolivianBrazilianBritishBritish West IndianBulgarianBurmeseCajunCambodianCanadianCape VerdeanCarpatho RusynCelticCentral AmericanCentral American IndianCherokeeCheyenneChickasawChileanChineseChippewaChoctawColombianColvilleComancheCosta RicanCreeCreekCroatianCrowCubanCypriotCzechCzechoslovakianDanishDelawareDominicanDutchDutch West IndianEastern EuropeanEcuadorianEgyptianEnglishEstonianEthiopianEuropeanFijianFilipinoFinnishFrenchFrench American IndianFrench CanadianGermanGerman RussianGhanaianGuamanian/ChamorroGuatemalanGuyaneseHaitianHmongHonduranHopiHoumaHungarianIcelanderIndian (Asian)IndonesianInupiatIranianIraqiIrishIroquoisIsraeliItalianJamaicanJapaneseJordanianKenyanKiowaKoreanLaotianLatvianLebaneseLiberianLithuanianLumbeeLuxembourgerMacedonianMalaysianMalteseMarshalleseMenomineeMexicanMexican American IndianMongolianMoroccanNative HawaiianNavajoNepaleseNew ZealanderNicaraguanNigerianNorthern EuropeanNorwegianOkinawanOsageOttawaPaiutePakistaniPalestinianPanamanianParaguayanPennsylvania GermanPeruvianPimaPolishPortuguesePotawatomiPuebloPuerto RicanPuget Sound SalishRomanianRussianSalvadoranSamoanScandinavianScotch-IrishScottishSeminoleSenegaleseSerbianShoshoneSierra LeoneanSiouxSlavicSlovakSloveneSomaliSouth AfricanSouth AmericanSouth American IndianSoviet UnionSpaniardSpanishSpanish AmericanSpanish American IndianSri LankanSubsaharan AfricanSudaneseSwedishSwissSyrianTaiwaneseThaiTlingit-HaidaTohono O'OdhamTonganTrinidadian and TobagonianTsimshianTurkishU.S. Virgin IslanderUgandanUkrainianUruguayanUteVenezuelanVietnameseWelshWest IndianYakamaYaquiYugoslavianYumanYup'ikZimbabwean
Immigration
NonimmigrantsImmigrantsAfghanistanAfricaAlbaniaArgentinaArmeniaAsiaAustraliaAustriaBahamasBangladeshBarbadosBelarusBelgiumBelizeBoliviaBosnia and HerzegovinaBrazilBulgariaBurma/MyanmarCabo VerdeCambodiaCameroonCanadaCaribbeanCentral AmericaChileChinaColombiaCongoCosta RicaCroatiaCubaCzechoslovakiaDenmarkDominicaDominican RepublicEastern AfricaEastern AsiaEastern EuropeEcuadorEgyptEl SalvadorEnglandEritreaEthiopiaEuropeFijiFranceGermanyGhanaGreeceGrenadaGuatemalaGuyanaHaitiHondurasHong KongHungaryIndiaIndonesiaIranIraqIrelandIsraelItalyJamaicaJapanJordanKazakhstanKenyaKoreaKuwaitLaosLatin AmericaLatviaLebanonLiberiaLithuaniaMalaysiaMexicoMicronesiaMiddle AfricaMoldovaMoroccoNepalNetherlandsNicaraguaNigeriaNorth AmericaNorth MacedoniaNorthern AfricaNorthern EuropeNorwayOceaniaPakistanPanamaPeruPhilippinesPolandPortugalRomaniaRussiaSaudi ArabiaScotlandSenegalSerbiaSierra LeoneSingaporeSomaliaSouth AfricaSouth AmericaSouth Central AsiaSouth Eastern AsiaSouthern EuropeSpainSri LankaSt. Vincent and the GrenadinesSudanSwedenSwitzerlandSyriaTaiwanThailandTrinidad and TobagoTurkeyUgandaUkraineUruguayUzbekistanVenezuelaVietnamWest IndiesWestern AfricaWestern AsiaWestern EuropeYemenZaireZimbabweAzores
Greek
Race
Ancestry
AfghanAfricanAlaska NativeAlaskan AthabascanAlbanianAleutAlsatianAmericanApacheArabArapahoArgentineanArmenianAssyrian/Chaldean/SyriacAustralianAustrianBahamianBangladeshiBarbadianBasqueBelgianBelizeanBermudanBhutaneseBlackfeetBolivianBrazilianBritishBritish West IndianBulgarianBurmeseCajunCambodianCanadianCape VerdeanCarpatho RusynCelticCentral AmericanCentral American IndianCherokeeCheyenneChickasawChileanChineseChippewaChoctawColombianColvilleComancheCosta RicanCreeCreekCroatianCrowCubanCypriotCzechCzechoslovakianDanishDelawareDominicanDutchDutch West IndianEastern EuropeanEcuadorianEgyptianEnglishEstonianEthiopianEuropeanFilipinoFinnishFrenchFrench American IndianFrench CanadianGermanGerman RussianGhanaianGreekGuamanian/ChamorroGuatemalanGuyaneseHaitianHmongHonduranHopiHoumaHungarianIcelanderIndian (Asian)IndonesianInupiatIranianIraqiIrishIroquoisIsraeliItalianJamaicanJapaneseJordanianKenyanKiowaKoreanLaotianLatvianLebaneseLiberianLithuanianLumbeeLuxembourgerMacedonianMalaysianMalteseMarshalleseMenomineeMexicanMexican American IndianMongolianMoroccanNative HawaiianNavajoNepaleseNew ZealanderNicaraguanNigerianNorthern EuropeanNorwegianOkinawanOsageOttawaPaiutePakistaniPalestinianPanamanianParaguayanPennsylvania GermanPeruvianPimaPolishPortuguesePotawatomiPuebloPuerto RicanPuget Sound SalishRomanianRussianSalvadoranSamoanScandinavianScotch-IrishScottishSeminoleSenegaleseSerbianShoshoneSierra LeoneanSiouxSlavicSlovakSloveneSomaliSouth AfricanSouth AmericanSouth American IndianSoviet UnionSpaniardSpanishSpanish AmericanSpanish American IndianSri LankanSubsaharan AfricanSudaneseSwedishSwissSyrianTaiwaneseThaiTlingit-HaidaTohono O'OdhamTonganTrinidadian and TobagonianTsimshianTurkishU.S. Virgin IslanderUgandanUkrainianUruguayanUteVenezuelanVietnameseWelshWest IndianYakamaYaquiYugoslavianYumanYup'ikZimbabwean
Immigration
NonimmigrantsImmigrantsAfghanistanAfricaAlbaniaArgentinaArmeniaAsiaAustraliaAustriaBahamasBangladeshBarbadosBelarusBelgiumBelizeBoliviaBosnia and HerzegovinaBrazilBulgariaBurma/MyanmarCabo VerdeCambodiaCameroonCanadaCaribbeanCentral AmericaChileChinaColombiaCongoCosta RicaCroatiaCubaCzechoslovakiaDenmarkDominicaDominican RepublicEastern AfricaEastern AsiaEastern EuropeEcuadorEgyptEl SalvadorEnglandEritreaEthiopiaEuropeFijiFranceGermanyGhanaGreeceGrenadaGuatemalaGuyanaHaitiHondurasHong KongHungaryIndiaIndonesiaIranIraqIrelandIsraelItalyJamaicaJapanJordanKazakhstanKenyaKoreaKuwaitLaosLatin AmericaLatviaLebanonLiberiaLithuaniaMalaysiaMexicoMicronesiaMiddle AfricaMoldovaMoroccoNepalNetherlandsNicaraguaNigeriaNorth AmericaNorth MacedoniaNorthern AfricaNorthern EuropeNorwayOceaniaPakistanPanamaPeruPhilippinesPolandPortugalRomaniaRussiaSaudi ArabiaScotlandSenegalSerbiaSierra LeoneSingaporeSomaliaSouth AfricaSouth AmericaSouth Central AsiaSouth Eastern AsiaSouthern EuropeSpainSri LankaSt. Vincent and the GrenadinesSudanSwedenSwitzerlandSyriaTaiwanThailandTrinidad and TobagoTurkeyUgandaUkraineUruguayUzbekistanVenezuelaVietnamWest IndiesWestern AfricaWestern AsiaWestern EuropeYemenZaireZimbabweAzores
Unemployment Among Women with Children Under 18 years
Income
Poverty
Unemployment
Labor Participation
Family Structure
Vehicle Availability
Education Level
Disability

Unemployment Among Women with Children Under 18 years Comparison

Fijians

Greeks

Exceptional
Exceptional
5.1%
UNEMPLOYMENT AMONG WOMEN WITH CHILDREN UNDER 18 YEARS
96.9/ 100
METRIC RATING
67th/ 347
METRIC RANK
5.0%
UNEMPLOYMENT AMONG WOMEN WITH CHILDREN UNDER 18 YEARS
99.0/ 100
METRIC RATING
40th/ 347
METRIC RANK

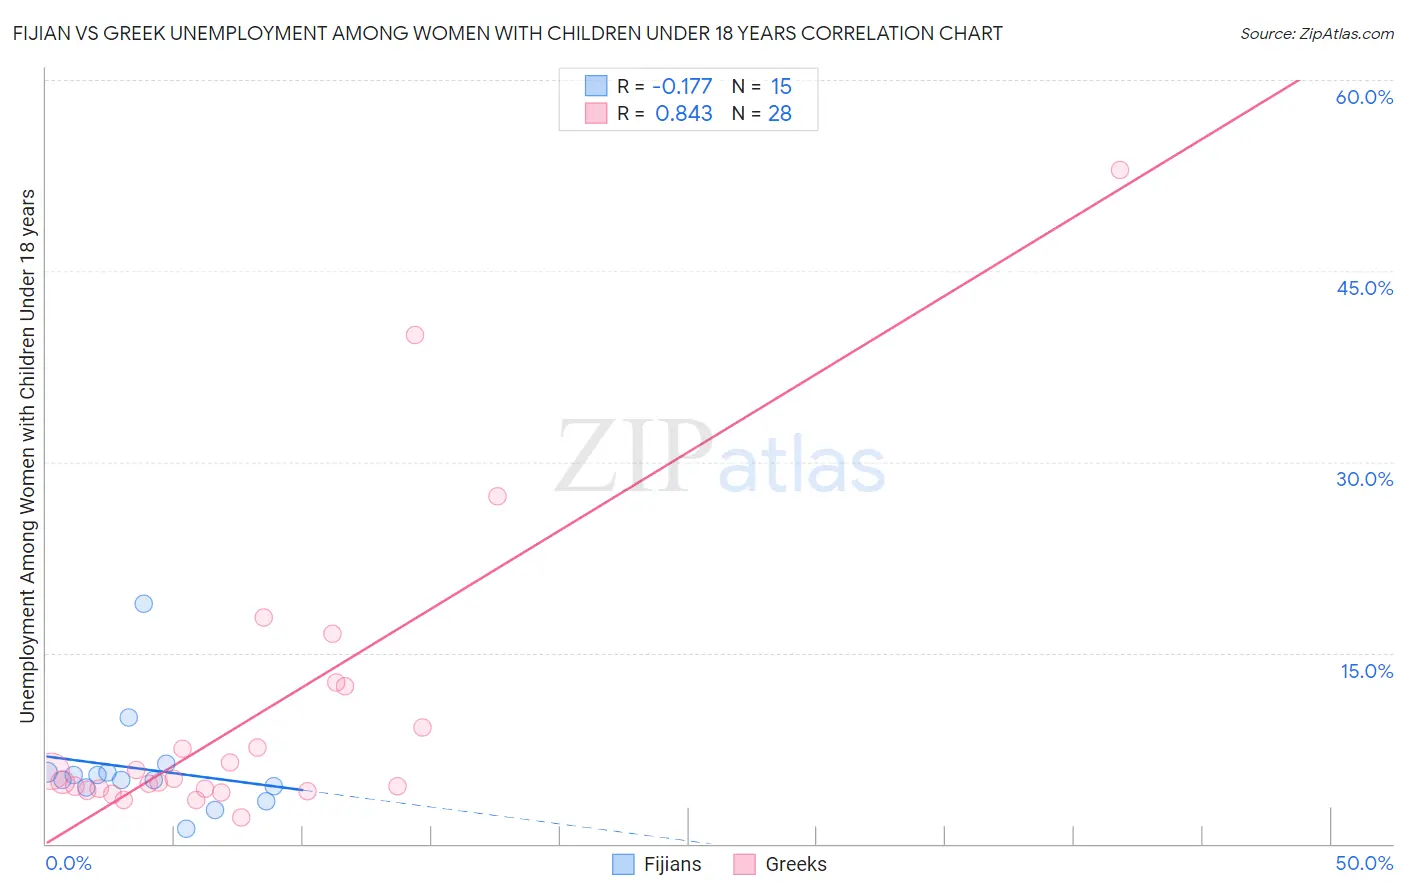
Fijian vs Greek Unemployment Among Women with Children Under 18 years Correlation Chart

The statistical analysis conducted on geographies consisting of 55,417,162 people shows a poor negative correlation between the proportion of Fijians and unemployment rate among women with children under the age of 18 in the United States with a correlation coefficient (R) of -0.177 and weighted average of 5.1%. Similarly, the statistical analysis conducted on geographies consisting of 453,324,679 people shows a very strong positive correlation between the proportion of Greeks and unemployment rate among women with children under the age of 18 in the United States with a correlation coefficient (R) of 0.843 and weighted average of 5.0%, a difference of 2.2%.
Fijian vs Greek Unemployment Among Women with Children Under 18 years

Unemployment Among Women with Children Under 18 years Correlation Summary

MeasurementFijianGreek
Minimum1.2%2.0%
Maximum18.8%52.9%
Range17.6%50.9%
Mean5.9%10.1%
Median5.0%5.0%
Interquartile 25% (IQ1)4.4%4.3%
Interquartile 75% (IQ3)5.6%10.7%
Interquartile Range (IQR)1.2%6.5%
Standard Deviation (Sample)4.1%11.8%
Standard Deviation (Population)3.9%11.6%

Similar Demographics by Unemployment Among Women with Children Under 18 years

Demographics Similar to Fijians by Unemployment Among Women with Children Under 18 years

In terms of unemployment among women with children under 18 years, the demographic groups most similar to Fijians are Immigrants from Australia (5.1%, a difference of 0.020%), Irish (5.1%, a difference of 0.090%), Immigrants from Sweden (5.1%, a difference of 0.12%), Estonian (5.1%, a difference of 0.14%), and Austrian (5.1%, a difference of 0.23%).
DemographicsRating | RankUnemployment Among Women with Children Under 18 years
Welsh
97.7
/100
|
#60
Exceptional
5.1%
Russians
97.5
/100
|
#61
Exceptional
5.1%
Immigrants | Bulgaria
97.4
/100
|
#62
Exceptional
5.1%
Italians
97.4
/100
|
#63
Exceptional
5.1%
Estonians
97.2
/100
|
#64
Exceptional
5.1%
Immigrants | Sweden
97.1
/100
|
#65
Exceptional
5.1%
Immigrants | Australia
97.0
/100
|
#66
Exceptional
5.1%
Fijians
96.9
/100
|
#67
Exceptional
5.1%
Irish
96.8
/100
|
#68
Exceptional
5.1%
Austrians
96.6
/100
|
#69
Exceptional
5.1%
Icelanders
96.6
/100
|
#70
Exceptional
5.1%
Serbians
96.5
/100
|
#71
Exceptional
5.1%
Immigrants | Bolivia
96.1
/100
|
#72
Exceptional
5.1%
Albanians
95.9
/100
|
#73
Exceptional
5.1%
Immigrants | Northern Europe
95.9
/100
|
#74
Exceptional
5.1%

Demographics Similar to Greeks by Unemployment Among Women with Children Under 18 years

In terms of unemployment among women with children under 18 years, the demographic groups most similar to Greeks are Immigrants from Bosnia and Herzegovina (5.0%, a difference of 0.060%), Eastern European (5.0%, a difference of 0.14%), Turkish (5.0%, a difference of 0.19%), English (5.0%, a difference of 0.25%), and Immigrants from Moldova (5.0%, a difference of 0.26%).
DemographicsRating | RankUnemployment Among Women with Children Under 18 years
Croatians
99.3
/100
|
#33
Exceptional
5.0%
Immigrants | South Central Asia
99.2
/100
|
#34
Exceptional
5.0%
Luxembourgers
99.2
/100
|
#35
Exceptional
5.0%
Mongolians
99.2
/100
|
#36
Exceptional
5.0%
Poles
99.2
/100
|
#37
Exceptional
5.0%
Bhutanese
99.2
/100
|
#38
Exceptional
5.0%
English
99.1
/100
|
#39
Exceptional
5.0%
Greeks
99.0
/100
|
#40
Exceptional
5.0%
Immigrants | Bosnia and Herzegovina
99.0
/100
|
#41
Exceptional
5.0%
Eastern Europeans
98.9
/100
|
#42
Exceptional
5.0%
Turks
98.9
/100
|
#43
Exceptional
5.0%
Immigrants | Moldova
98.9
/100
|
#44
Exceptional
5.0%
Immigrants | Malaysia
98.8
/100
|
#45
Exceptional
5.0%
Immigrants | Korea
98.7
/100
|
#46
Exceptional
5.0%
British
98.7
/100
|
#47
Exceptional
5.0%