European vs Central American Unemployment Among Ages 16 to 19 years
COMPARE
European
Central American
Unemployment Among Ages 16 to 19 years
Unemployment Among Ages 16 to 19 years Comparison
Europeans
Central Americans
16.1%
UNEMPLOYMENT AMONG AGES 16 TO 19 YEARS
99.9/ 100
METRIC RATING
32nd/ 347
METRIC RANK
18.8%
UNEMPLOYMENT AMONG AGES 16 TO 19 YEARS
0.3/ 100
METRIC RATING
253rd/ 347
METRIC RANK
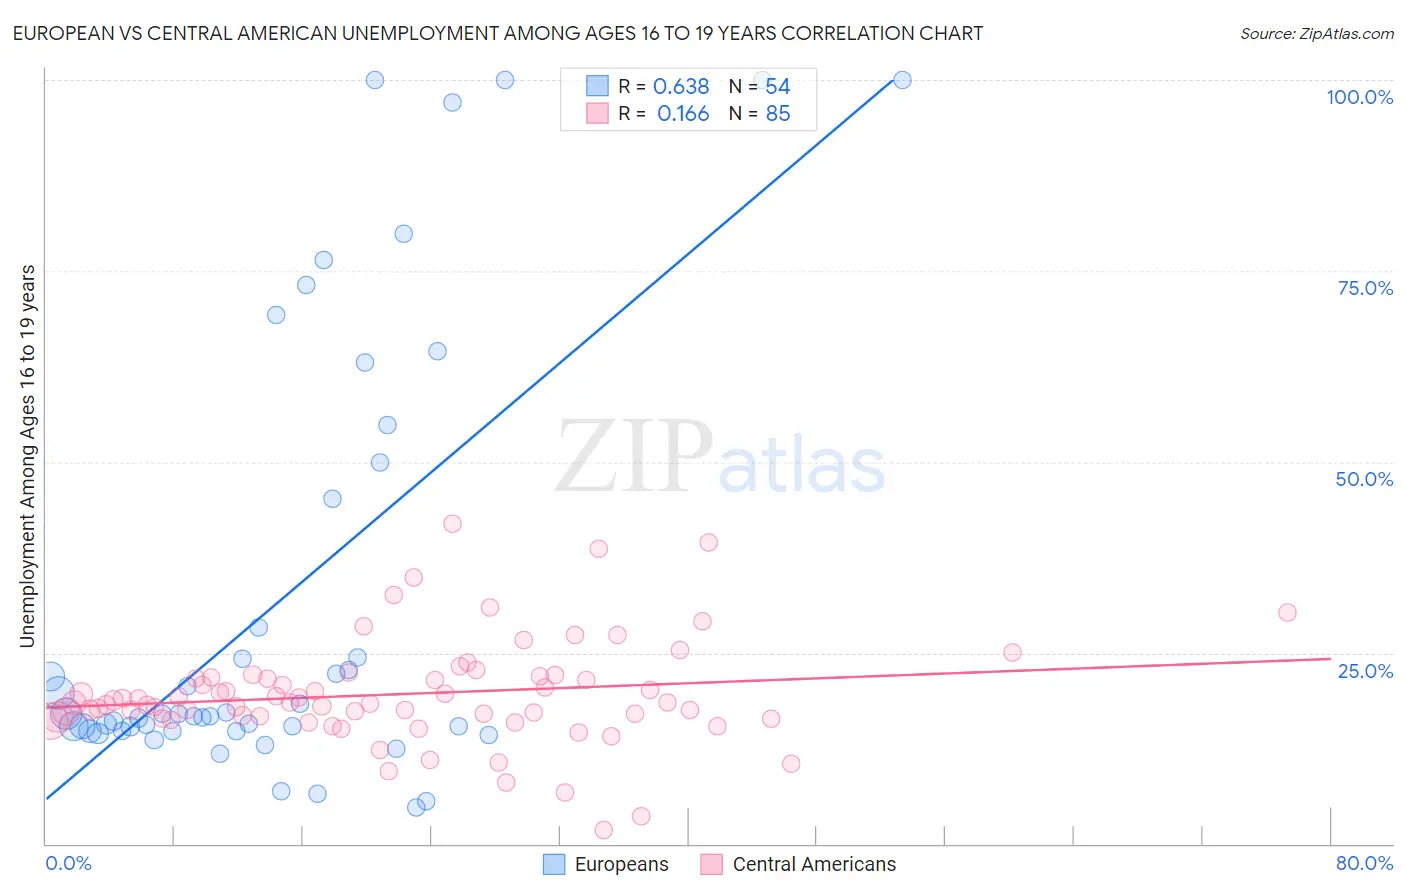
European vs Central American Unemployment Among Ages 16 to 19 years Correlation Chart
The statistical analysis conducted on geographies consisting of 503,228,769 people shows a significant positive correlation between the proportion of Europeans and unemployment rate among population between the ages 16 and 19 in the United States with a correlation coefficient (R) of 0.638 and weighted average of 16.1%. Similarly, the statistical analysis conducted on geographies consisting of 468,892,359 people shows a poor positive correlation between the proportion of Central Americans and unemployment rate among population between the ages 16 and 19 in the United States with a correlation coefficient (R) of 0.166 and weighted average of 18.8%, a difference of 16.5%.
Unemployment Among Ages 16 to 19 years Correlation Summary
| Measurement | European | Central American |
| Minimum | 4.8% | 1.8% |
| Maximum | 100.0% | 41.9% |
| Range | 95.2% | 40.1% |
| Mean | 31.7% | 19.6% |
| Median | 16.9% | 18.5% |
| Interquartile 25% (IQ1) | 14.8% | 16.5% |
| Interquartile 75% (IQ3) | 45.1% | 21.8% |
| Interquartile Range (IQR) | 30.3% | 5.3% |
| Standard Deviation (Sample) | 28.9% | 6.9% |
| Standard Deviation (Population) | 28.6% | 6.8% |
Similar Demographics by Unemployment Among Ages 16 to 19 years
Demographics Similar to Europeans by Unemployment Among Ages 16 to 19 years
In terms of unemployment among ages 16 to 19 years, the demographic groups most similar to Europeans are English (16.1%, a difference of 0.39%), Kenyan (16.1%, a difference of 0.45%), Chinese (16.0%, a difference of 0.48%), Immigrants from Kenya (16.2%, a difference of 0.51%), and Jordanian (16.0%, a difference of 0.54%).
| Demographics | Rating | Rank | Unemployment Among Ages 16 to 19 years |
| Filipinos | 100.0 /100 | #25 | Exceptional 15.9% |
| Dutch | 100.0 /100 | #26 | Exceptional 15.9% |
| Immigrants | Sudan | 99.9 /100 | #27 | Exceptional 16.0% |
| Jordanians | 99.9 /100 | #28 | Exceptional 16.0% |
| Chinese | 99.9 /100 | #29 | Exceptional 16.0% |
| Kenyans | 99.9 /100 | #30 | Exceptional 16.1% |
| English | 99.9 /100 | #31 | Exceptional 16.1% |
| Europeans | 99.9 /100 | #32 | Exceptional 16.1% |
| Immigrants | Kenya | 99.9 /100 | #33 | Exceptional 16.2% |
| Pennsylvania Germans | 99.9 /100 | #34 | Exceptional 16.2% |
| Scottish | 99.8 /100 | #35 | Exceptional 16.2% |
| Immigrants | South Central Asia | 99.8 /100 | #36 | Exceptional 16.2% |
| Immigrants | Congo | 99.8 /100 | #37 | Exceptional 16.3% |
| Bulgarians | 99.8 /100 | #38 | Exceptional 16.3% |
| Croatians | 99.8 /100 | #39 | Exceptional 16.3% |
Demographics Similar to Central Americans by Unemployment Among Ages 16 to 19 years
In terms of unemployment among ages 16 to 19 years, the demographic groups most similar to Central Americans are Apache (18.8%, a difference of 0.030%), Immigrants from Cameroon (18.8%, a difference of 0.040%), Mexican American Indian (18.8%, a difference of 0.11%), Immigrants from Guatemala (18.7%, a difference of 0.30%), and Subsaharan African (18.7%, a difference of 0.33%).
| Demographics | Rating | Rank | Unemployment Among Ages 16 to 19 years |
| Immigrants | South America | 0.5 /100 | #246 | Tragic 18.7% |
| Immigrants | Israel | 0.5 /100 | #247 | Tragic 18.7% |
| Delaware | 0.5 /100 | #248 | Tragic 18.7% |
| Puget Sound Salish | 0.5 /100 | #249 | Tragic 18.7% |
| Panamanians | 0.4 /100 | #250 | Tragic 18.7% |
| Sub-Saharan Africans | 0.4 /100 | #251 | Tragic 18.7% |
| Immigrants | Guatemala | 0.4 /100 | #252 | Tragic 18.7% |
| Central Americans | 0.3 /100 | #253 | Tragic 18.8% |
| Apache | 0.3 /100 | #254 | Tragic 18.8% |
| Immigrants | Cameroon | 0.3 /100 | #255 | Tragic 18.8% |
| Mexican American Indians | 0.3 /100 | #256 | Tragic 18.8% |
| Immigrants | Nigeria | 0.2 /100 | #257 | Tragic 18.9% |
| Immigrants | Mexico | 0.2 /100 | #258 | Tragic 18.9% |
| Immigrants | Central America | 0.2 /100 | #259 | Tragic 18.9% |
| Nigerians | 0.2 /100 | #260 | Tragic 18.9% |