European vs Burmese Unemployment Among Ages 20 to 24 years

COMPARE

European
Race
Ancestry
AfghanAfricanAlaska NativeAlaskan AthabascanAlbanianAleutAlsatianAmericanApacheArabArapahoArgentineanArmenianAssyrian/Chaldean/SyriacAustralianAustrianBahamianBangladeshiBarbadianBasqueBelgianBelizeanBermudanBhutaneseBlackfeetBolivianBrazilianBritishBritish West IndianBulgarianCajunCambodianCanadianCape VerdeanCarpatho RusynCelticCentral AmericanCentral American IndianCherokeeCheyenneChickasawChileanChineseChippewaChoctawColombianColvilleComancheCosta RicanCreeCreekCroatianCrowCubanCypriotCzechCzechoslovakianDanishDelawareDominicanDutchDutch West IndianEastern EuropeanEcuadorianEgyptianEnglishEstonianEthiopianEuropeanFijianFilipinoFinnishFrenchFrench American IndianFrench CanadianGermanGerman RussianGhanaianGreekGuamanian/ChamorroGuatemalanGuyaneseHaitianHmongHonduranHopiHoumaHungarianIcelanderIndian (Asian)IndonesianInupiatIranianIraqiIrishIroquoisIsraeliItalianJamaicanJapaneseJordanianKenyanKiowaKoreanLaotianLatvianLebaneseLiberianLithuanianLumbeeLuxembourgerMacedonianMalaysianMalteseMarshalleseMenomineeMexicanMexican American IndianMongolianMoroccanNative HawaiianNavajoNepaleseNew ZealanderNicaraguanNigerianNorthern EuropeanNorwegianOkinawanOsageOttawaPaiutePakistaniPalestinianPanamanianParaguayanPennsylvania GermanPeruvianPimaPolishPortuguesePotawatomiPuebloPuerto RicanPuget Sound SalishRomanianRussianSalvadoranSamoanScandinavianScotch-IrishScottishSeminoleSenegaleseSerbianShoshoneSierra LeoneanSiouxSlavicSlovakSloveneSomaliSouth AfricanSouth AmericanSouth American IndianSoviet UnionSpaniardSpanishSpanish AmericanSpanish American IndianSri LankanSubsaharan AfricanSudaneseSwedishSwissSyrianTaiwaneseThaiTlingit-HaidaTohono O'OdhamTonganTrinidadian and TobagonianTsimshianTurkishU.S. Virgin IslanderUgandanUkrainianUruguayanUteVenezuelanVietnameseWelshWest IndianYakamaYaquiYugoslavianYumanYup'ikZimbabwean
Immigration
NonimmigrantsImmigrantsAfghanistanAfricaAlbaniaArgentinaArmeniaAsiaAustraliaAustriaBahamasBangladeshBarbadosBelarusBelgiumBelizeBoliviaBosnia and HerzegovinaBrazilBulgariaBurma/MyanmarCabo VerdeCambodiaCameroonCanadaCaribbeanCentral AmericaChileChinaColombiaCongoCosta RicaCroatiaCubaCzechoslovakiaDenmarkDominicaDominican RepublicEastern AfricaEastern AsiaEastern EuropeEcuadorEgyptEl SalvadorEnglandEritreaEthiopiaEuropeFijiFranceGermanyGhanaGreeceGrenadaGuatemalaGuyanaHaitiHondurasHong KongHungaryIndiaIndonesiaIranIraqIrelandIsraelItalyJamaicaJapanJordanKazakhstanKenyaKoreaKuwaitLaosLatin AmericaLatviaLebanonLiberiaLithuaniaMalaysiaMexicoMicronesiaMiddle AfricaMoldovaMoroccoNepalNetherlandsNicaraguaNigeriaNorth AmericaNorth MacedoniaNorthern AfricaNorthern EuropeNorwayOceaniaPakistanPanamaPeruPhilippinesPolandPortugalRomaniaRussiaSaudi ArabiaScotlandSenegalSerbiaSierra LeoneSingaporeSomaliaSouth AfricaSouth AmericaSouth Central AsiaSouth Eastern AsiaSouthern EuropeSpainSri LankaSt. Vincent and the GrenadinesSudanSwedenSwitzerlandSyriaTaiwanThailandTrinidad and TobagoTurkeyUgandaUkraineUruguayUzbekistanVenezuelaVietnamWest IndiesWestern AfricaWestern AsiaWestern EuropeYemenZaireZimbabweAzores
Burmese
Race
Ancestry
AfghanAfricanAlaska NativeAlaskan AthabascanAlbanianAleutAlsatianAmericanApacheArabArapahoArgentineanArmenianAssyrian/Chaldean/SyriacAustralianAustrianBahamianBangladeshiBarbadianBasqueBelgianBelizeanBermudanBhutaneseBlackfeetBolivianBrazilianBritishBritish West IndianBulgarianBurmeseCajunCambodianCanadianCape VerdeanCarpatho RusynCelticCentral AmericanCentral American IndianCherokeeCheyenneChickasawChileanChineseChippewaChoctawColombianColvilleComancheCosta RicanCreeCreekCroatianCrowCubanCypriotCzechCzechoslovakianDanishDelawareDominicanDutchDutch West IndianEastern EuropeanEcuadorianEgyptianEnglishEstonianEthiopianFijianFilipinoFinnishFrenchFrench American IndianFrench CanadianGermanGerman RussianGhanaianGreekGuamanian/ChamorroGuatemalanGuyaneseHaitianHmongHonduranHopiHoumaHungarianIcelanderIndian (Asian)IndonesianInupiatIranianIraqiIrishIroquoisIsraeliItalianJamaicanJapaneseJordanianKenyanKiowaKoreanLaotianLatvianLebaneseLiberianLithuanianLumbeeLuxembourgerMacedonianMalaysianMalteseMarshalleseMenomineeMexicanMexican American IndianMongolianMoroccanNative HawaiianNavajoNepaleseNew ZealanderNicaraguanNigerianNorthern EuropeanNorwegianOkinawanOsageOttawaPaiutePakistaniPalestinianPanamanianParaguayanPennsylvania GermanPeruvianPimaPolishPortuguesePotawatomiPuebloPuerto RicanPuget Sound SalishRomanianRussianSalvadoranSamoanScandinavianScotch-IrishScottishSeminoleSenegaleseSerbianShoshoneSierra LeoneanSiouxSlavicSlovakSloveneSomaliSouth AfricanSouth AmericanSouth American IndianSoviet UnionSpaniardSpanishSpanish AmericanSpanish American IndianSri LankanSubsaharan AfricanSudaneseSwedishSwissSyrianTaiwaneseThaiTlingit-HaidaTohono O'OdhamTonganTrinidadian and TobagonianTsimshianTurkishU.S. Virgin IslanderUgandanUkrainianUruguayanUteVenezuelanVietnameseWelshWest IndianYakamaYaquiYugoslavianYumanYup'ikZimbabwean
Immigration
NonimmigrantsImmigrantsAfghanistanAfricaAlbaniaArgentinaArmeniaAsiaAustraliaAustriaBahamasBangladeshBarbadosBelarusBelgiumBelizeBoliviaBosnia and HerzegovinaBrazilBulgariaBurma/MyanmarCabo VerdeCambodiaCameroonCanadaCaribbeanCentral AmericaChileChinaColombiaCongoCosta RicaCroatiaCubaCzechoslovakiaDenmarkDominicaDominican RepublicEastern AfricaEastern AsiaEastern EuropeEcuadorEgyptEl SalvadorEnglandEritreaEthiopiaEuropeFijiFranceGermanyGhanaGreeceGrenadaGuatemalaGuyanaHaitiHondurasHong KongHungaryIndiaIndonesiaIranIraqIrelandIsraelItalyJamaicaJapanJordanKazakhstanKenyaKoreaKuwaitLaosLatin AmericaLatviaLebanonLiberiaLithuaniaMalaysiaMexicoMicronesiaMiddle AfricaMoldovaMoroccoNepalNetherlandsNicaraguaNigeriaNorth AmericaNorth MacedoniaNorthern AfricaNorthern EuropeNorwayOceaniaPakistanPanamaPeruPhilippinesPolandPortugalRomaniaRussiaSaudi ArabiaScotlandSenegalSerbiaSierra LeoneSingaporeSomaliaSouth AfricaSouth AmericaSouth Central AsiaSouth Eastern AsiaSouthern EuropeSpainSri LankaSt. Vincent and the GrenadinesSudanSwedenSwitzerlandSyriaTaiwanThailandTrinidad and TobagoTurkeyUgandaUkraineUruguayUzbekistanVenezuelaVietnamWest IndiesWestern AfricaWestern AsiaWestern EuropeYemenZaireZimbabweAzores
Unemployment Among Ages 20 to 24 years
Income
Poverty
Unemployment
Labor Participation
Family Structure
Vehicle Availability
Education Level
Disability

Unemployment Among Ages 20 to 24 years Comparison

Europeans

Burmese

Exceptional
Excellent
9.7%
UNEMPLOYMENT AMONG AGES 20 TO 24 YEARS
99.8/ 100
METRIC RATING
44th/ 347
METRIC RANK
10.2%
UNEMPLOYMENT AMONG AGES 20 TO 24 YEARS
82.3/ 100
METRIC RATING
138th/ 347
METRIC RANK

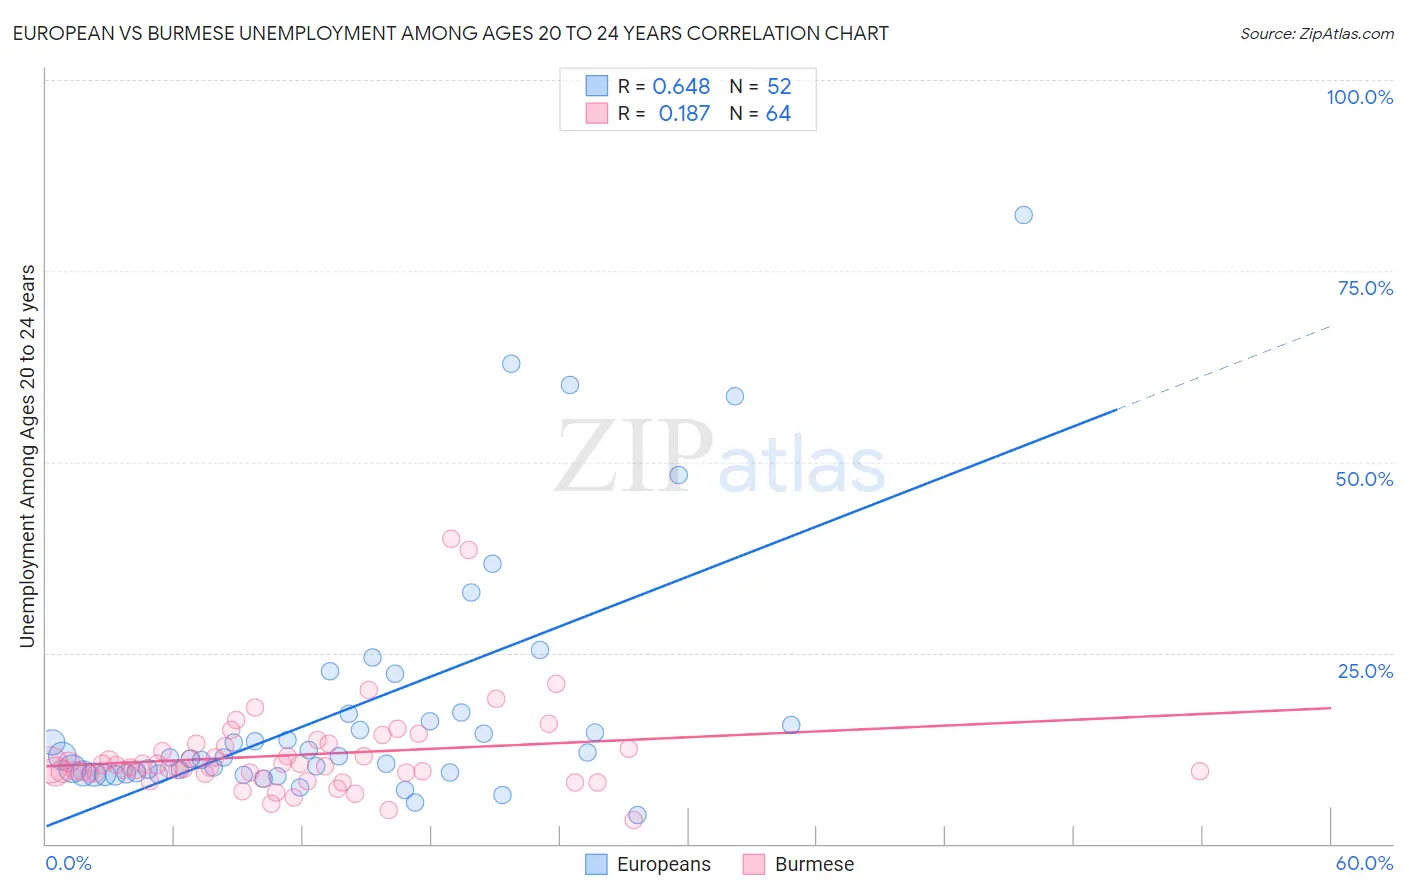
European vs Burmese Unemployment Among Ages 20 to 24 years Correlation Chart

The statistical analysis conducted on geographies consisting of 517,284,454 people shows a significant positive correlation between the proportion of Europeans and unemployment rate among population between the ages 20 and 24 in the United States with a correlation coefficient (R) of 0.648 and weighted average of 9.7%. Similarly, the statistical analysis conducted on geographies consisting of 446,818,216 people shows a poor positive correlation between the proportion of Burmese and unemployment rate among population between the ages 20 and 24 in the United States with a correlation coefficient (R) of 0.187 and weighted average of 10.2%, a difference of 4.7%.
European vs Burmese Unemployment Among Ages 20 to 24 years

Unemployment Among Ages 20 to 24 years Correlation Summary

MeasurementEuropeanBurmese
Minimum3.8%3.1%
Maximum82.4%40.0%
Range78.6%36.9%
Mean17.7%11.6%
Median11.3%10.1%
Interquartile 25% (IQ1)9.2%9.2%
Interquartile 75% (IQ3)16.6%12.6%
Interquartile Range (IQR)7.3%3.4%
Standard Deviation (Sample)16.4%6.1%
Standard Deviation (Population)16.2%6.0%

Similar Demographics by Unemployment Among Ages 20 to 24 years

Demographics Similar to Europeans by Unemployment Among Ages 20 to 24 years

In terms of unemployment among ages 20 to 24 years, the demographic groups most similar to Europeans are Croatian (9.7%, a difference of 0.060%), Immigrants from Nicaragua (9.7%, a difference of 0.070%), Menominee (9.7%, a difference of 0.13%), Immigrants from India (9.7%, a difference of 0.19%), and Finnish (9.7%, a difference of 0.20%).
DemographicsRating | RankUnemployment Among Ages 20 to 24 years
Immigrants | Zaire
100.0
/100
|
#37
Exceptional
9.6%
Afghans
99.9
/100
|
#38
Exceptional
9.6%
Dutch
99.9
/100
|
#39
Exceptional
9.6%
Immigrants | Ethiopia
99.9
/100
|
#40
Exceptional
9.6%
Swiss
99.9
/100
|
#41
Exceptional
9.7%
Immigrants | Saudi Arabia
99.9
/100
|
#42
Exceptional
9.7%
Menominee
99.8
/100
|
#43
Exceptional
9.7%
Europeans
99.8
/100
|
#44
Exceptional
9.7%
Croatians
99.8
/100
|
#45
Exceptional
9.7%
Immigrants | Nicaragua
99.8
/100
|
#46
Exceptional
9.7%
Immigrants | India
99.8
/100
|
#47
Exceptional
9.7%
Finns
99.8
/100
|
#48
Exceptional
9.7%
Creek
99.8
/100
|
#49
Exceptional
9.7%
Immigrants | Kenya
99.7
/100
|
#50
Exceptional
9.7%
Ethiopians
99.7
/100
|
#51
Exceptional
9.8%

Demographics Similar to Burmese by Unemployment Among Ages 20 to 24 years

In terms of unemployment among ages 20 to 24 years, the demographic groups most similar to Burmese are Immigrants from Northern Africa (10.2%, a difference of 0.010%), Immigrants from North America (10.2%, a difference of 0.010%), Uruguayan (10.2%, a difference of 0.020%), Immigrants from Austria (10.2%, a difference of 0.060%), and Immigrants from the Azores (10.2%, a difference of 0.060%).
DemographicsRating | RankUnemployment Among Ages 20 to 24 years
Seminole
84.2
/100
|
#131
Excellent
10.1%
Immigrants | South Eastern Asia
84.0
/100
|
#132
Excellent
10.1%
Austrians
83.9
/100
|
#133
Excellent
10.2%
Romanians
83.8
/100
|
#134
Excellent
10.2%
Comanche
83.4
/100
|
#135
Excellent
10.2%
Immigrants | Northern Africa
82.5
/100
|
#136
Excellent
10.2%
Immigrants | North America
82.5
/100
|
#137
Excellent
10.2%
Burmese
82.3
/100
|
#138
Excellent
10.2%
Uruguayans
81.9
/100
|
#139
Excellent
10.2%
Immigrants | Austria
81.4
/100
|
#140
Excellent
10.2%
Immigrants | Azores
81.4
/100
|
#141
Excellent
10.2%
Slovaks
80.2
/100
|
#142
Excellent
10.2%
Immigrants | Jordan
79.0
/100
|
#143
Good
10.2%
Brazilians
78.4
/100
|
#144
Good
10.2%
Argentineans
78.0
/100
|
#145
Good
10.2%