Ethiopian vs Scotch-Irish Female Unemployment
COMPARE
Ethiopian
Scotch-Irish
Female Unemployment
Female Unemployment Comparison
Ethiopians
Scotch-Irish
5.1%
FEMALE UNEMPLOYMENT
85.7/ 100
METRIC RATING
129th/ 347
METRIC RANK
4.8%
FEMALE UNEMPLOYMENT
99.6/ 100
METRIC RATING
39th/ 347
METRIC RANK
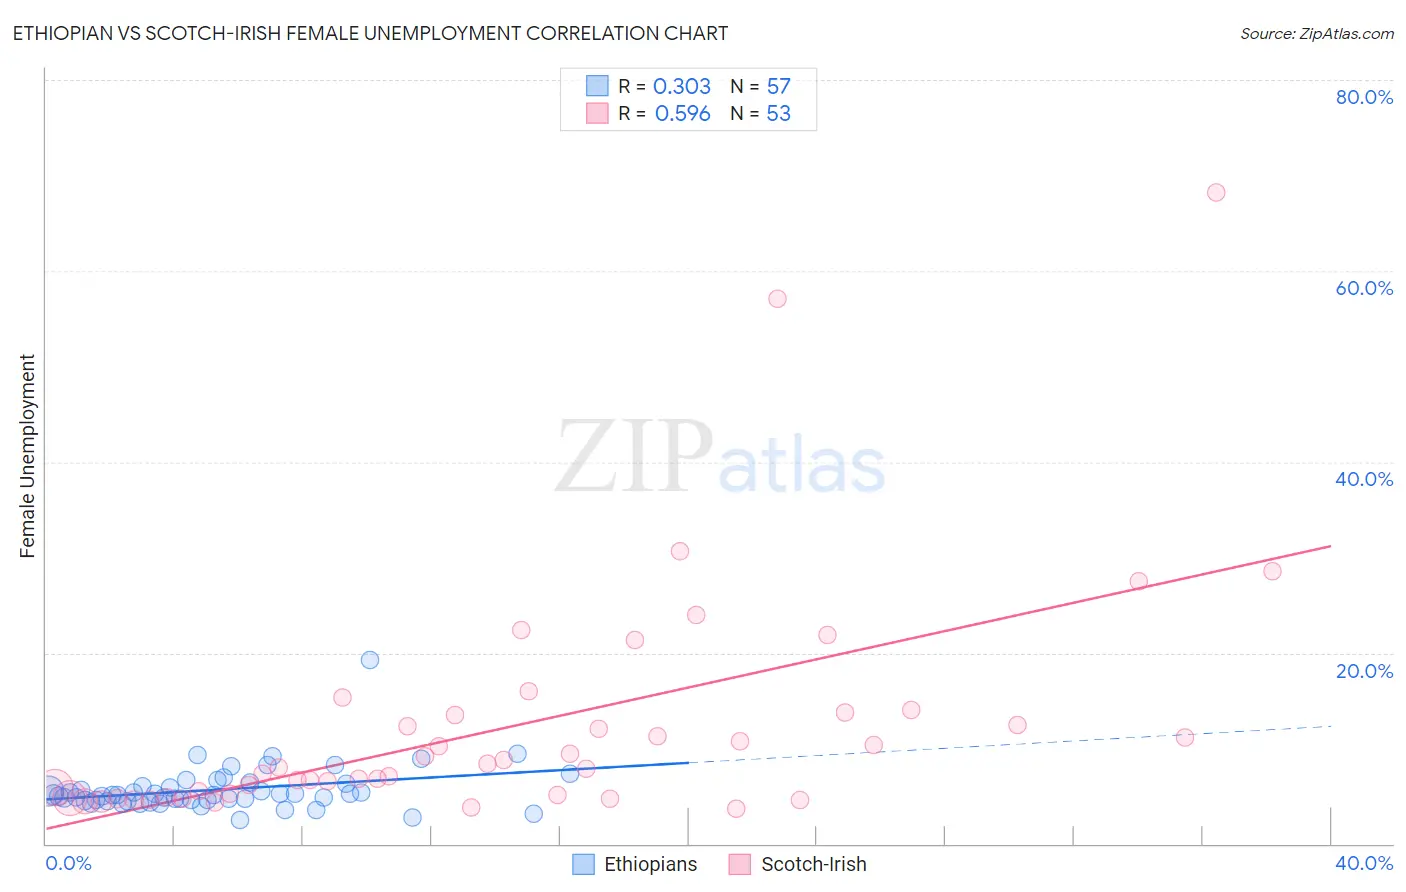
Ethiopian vs Scotch-Irish Female Unemployment Correlation Chart
The statistical analysis conducted on geographies consisting of 222,927,979 people shows a mild positive correlation between the proportion of Ethiopians and unemploymnet rate among females in the United States with a correlation coefficient (R) of 0.303 and weighted average of 5.1%. Similarly, the statistical analysis conducted on geographies consisting of 537,046,188 people shows a substantial positive correlation between the proportion of Scotch-Irish and unemploymnet rate among females in the United States with a correlation coefficient (R) of 0.596 and weighted average of 4.8%, a difference of 6.1%.
Female Unemployment Correlation Summary
| Measurement | Ethiopian | Scotch-Irish |
| Minimum | 2.5% | 3.7% |
| Maximum | 19.3% | 68.2% |
| Range | 16.8% | 64.5% |
| Mean | 5.7% | 12.3% |
| Median | 5.1% | 8.0% |
| Interquartile 25% (IQ1) | 4.5% | 5.0% |
| Interquartile 75% (IQ3) | 6.1% | 13.6% |
| Interquartile Range (IQR) | 1.6% | 8.7% |
| Standard Deviation (Sample) | 2.4% | 12.2% |
| Standard Deviation (Population) | 2.4% | 12.1% |
Similar Demographics by Female Unemployment
Demographics Similar to Ethiopians by Female Unemployment
In terms of female unemployment, the demographic groups most similar to Ethiopians are Chilean (5.1%, a difference of 0.010%), Maltese (5.1%, a difference of 0.030%), Immigrants from Hungary (5.1%, a difference of 0.040%), Immigrants from Ethiopia (5.1%, a difference of 0.050%), and Immigrants from Korea (5.1%, a difference of 0.080%).
| Demographics | Rating | Rank | Female Unemployment |
| Immigrants | Germany | 87.6 /100 | #122 | Excellent 5.1% |
| Immigrants | South Africa | 87.6 /100 | #123 | Excellent 5.1% |
| Immigrants | Europe | 87.2 /100 | #124 | Excellent 5.1% |
| Basques | 86.5 /100 | #125 | Excellent 5.1% |
| Immigrants | Korea | 86.3 /100 | #126 | Excellent 5.1% |
| Immigrants | Hungary | 86.0 /100 | #127 | Excellent 5.1% |
| Chileans | 85.8 /100 | #128 | Excellent 5.1% |
| Ethiopians | 85.7 /100 | #129 | Excellent 5.1% |
| Maltese | 85.5 /100 | #130 | Excellent 5.1% |
| Immigrants | Ethiopia | 85.4 /100 | #131 | Excellent 5.1% |
| Immigrants | Sri Lanka | 85.0 /100 | #132 | Excellent 5.1% |
| Immigrants | Hong Kong | 84.8 /100 | #133 | Excellent 5.1% |
| Immigrants | Eritrea | 84.6 /100 | #134 | Excellent 5.1% |
| Immigrants | Latvia | 84.6 /100 | #135 | Excellent 5.1% |
| Indians (Asian) | 84.2 /100 | #136 | Excellent 5.1% |
Demographics Similar to Scotch-Irish by Female Unemployment
In terms of female unemployment, the demographic groups most similar to Scotch-Irish are Northern European (4.8%, a difference of 0.010%), French (4.8%, a difference of 0.040%), Pennsylvania German (4.8%, a difference of 0.12%), Tongan (4.8%, a difference of 0.30%), and Italian (4.8%, a difference of 0.43%).
| Demographics | Rating | Rank | Female Unemployment |
| Slovaks | 99.8 /100 | #32 | Exceptional 4.8% |
| Czechoslovakians | 99.7 /100 | #33 | Exceptional 4.8% |
| Zimbabweans | 99.7 /100 | #34 | Exceptional 4.8% |
| French Canadians | 99.7 /100 | #35 | Exceptional 4.8% |
| Yugoslavians | 99.7 /100 | #36 | Exceptional 4.8% |
| Pennsylvania Germans | 99.6 /100 | #37 | Exceptional 4.8% |
| Northern Europeans | 99.6 /100 | #38 | Exceptional 4.8% |
| Scotch-Irish | 99.6 /100 | #39 | Exceptional 4.8% |
| French | 99.6 /100 | #40 | Exceptional 4.8% |
| Tongans | 99.5 /100 | #41 | Exceptional 4.8% |
| Italians | 99.5 /100 | #42 | Exceptional 4.8% |
| Eastern Europeans | 99.4 /100 | #43 | Exceptional 4.9% |
| Greeks | 99.4 /100 | #44 | Exceptional 4.9% |
| Austrians | 99.3 /100 | #45 | Exceptional 4.9% |
| Immigrants | Bulgaria | 99.3 /100 | #46 | Exceptional 4.9% |